
(Source code, png, hires.png, pdf)
#!/usr/bin/env python
import numpy as np
import matplotlib.cm as cm
from matplotlib.pyplot import figure, show, rc
# force square figure and square axes looks better for polar, IMO
fig = figure(figsize=(8,8))
ax = fig.add_axes([0.1, 0.1, 0.8, 0.8], polar=True)
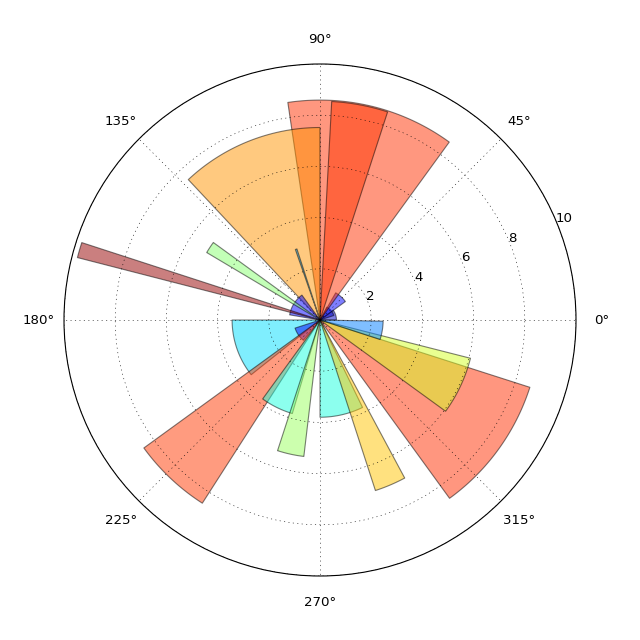
N = 20
theta = np.arange(0.0, 2*np.pi, 2*np.pi/N)
radii = 10*np.random.rand(N)
width = np.pi/4*np.random.rand(N)
bars = ax.bar(theta, radii, width=width, bottom=0.0)
for r,bar in zip(radii, bars):
bar.set_facecolor( cm.jet(r/10.))
bar.set_alpha(0.5)
show()
Keywords: python, matplotlib, pylab, example, codex (see Search examples)