
(Source code, png, hires.png, pdf)

from pylab import *
from matplotlib.colors import LogNorm
N = 100
x = linspace(-3.0, 3.0, N)
y = linspace(-2.0, 2.0, N)
X, Y = meshgrid(x, y)
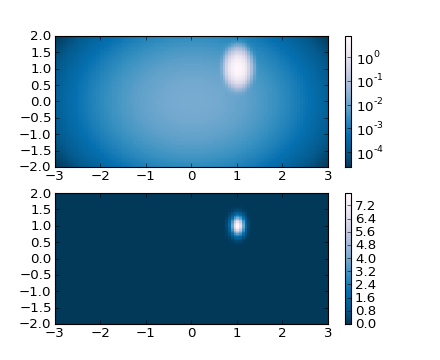
# A low hump with a spike coming out of the top right.
# Needs to have z/colour axis on a log scale so we see both hump and spike.
# linear scale only shows the spike.
Z1 = bivariate_normal(X, Y, 0.1, 0.2, 1.0, 1.0) + 0.1*bivariate_normal(X, Y, 1.0, 1.0, 0.0, 0.0)
subplot(2,1,1)
pcolor(X, Y, Z1, norm=LogNorm(vmin=Z1.min(), vmax=Z1.max()), cmap=cm.PuBu_r)
colorbar()
subplot(2,1,2)
pcolor(X, Y, Z1, cmap=cm.PuBu_r)
colorbar()
show()
Keywords: python, matplotlib, pylab, example, codex (see Search examples)