
(Source code, png, hires.png, pdf)
#!/usr/bin/env python
"""
See pcolor_demo2 for a much faster way of generating pcolor plots
"""
from __future__ import division
from pylab import *
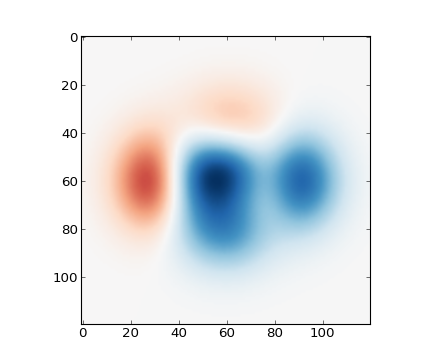
def func3(x,y):
return (1- x/2 + x**5 + y**3)*exp(-x**2-y**2)
# make these smaller to increase the resolution
dx, dy = 0.05, 0.05
x = arange(-3.0, 3.0, dx)
y = arange(-3.0, 3.0, dy)
X,Y = meshgrid(x, y)
Z = func3(X, Y)
ax = subplot(111)
im = imshow(Z, cmap=cm.RdBu, vmax=abs(Z).max(), vmin=-abs(Z).max())
#im.set_interpolation('nearest')
#im.set_interpolation('bicubic')
im.set_interpolation('bilinear')
#ax.set_image_extent(-3, 3, -3, 3)
show()
Keywords: python, matplotlib, pylab, example, codex (see Search examples)