
(Source code, png, hires.png, pdf)

import matplotlib.pyplot as plt
import matplotlib.patheffects as PathEffects
import numpy as np
if 1:
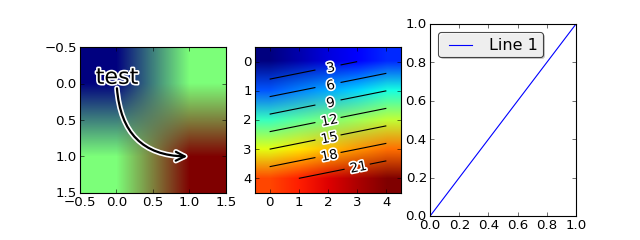
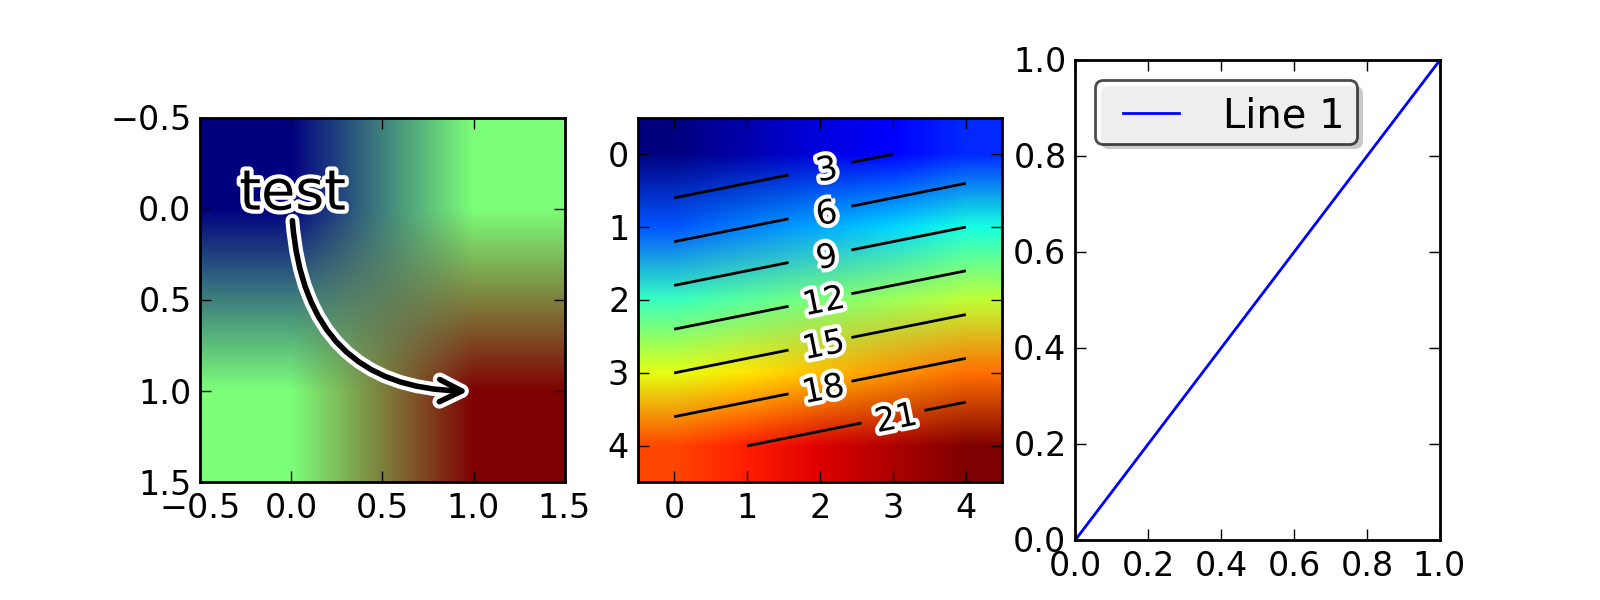
plt.figure(1, figsize=(8,3))
ax1 = plt.subplot(131)
ax1.imshow([[1,2],[2,3]])
txt = ax1.annotate("test", (1., 1.), (0., 0),
arrowprops=dict(arrowstyle="->",
connectionstyle="angle3", lw=2),
size=20, ha="center")
txt.set_path_effects([PathEffects.withStroke(linewidth=3,
foreground="w")])
txt.arrow_patch.set_path_effects([PathEffects.Stroke(linewidth=5,
foreground="w"),
PathEffects.Normal()])
ax2 = plt.subplot(132)
arr = np.arange(25).reshape((5,5))
ax2.imshow(arr)
cntr = ax2.contour(arr, colors="k")
clbls = ax2.clabel(cntr, fmt="%2.0f", use_clabeltext=True)
plt.setp(clbls,
path_effects=[PathEffects.withStroke(linewidth=3,
foreground="w")])
# shadow as a path effect
ax3 = plt.subplot(133)
p1, = ax3.plot([0, 1], [0, 1])
leg = ax3.legend([p1], ["Line 1"], fancybox=True, loc=2)
leg.legendPatch.set_path_effects([PathEffects.withSimplePatchShadow()])
plt.show()
Keywords: python, matplotlib, pylab, example, codex (see Search examples)