
#!/usr/bin/env python
"""Simple matshow() example."""
from matplotlib.pylab import *
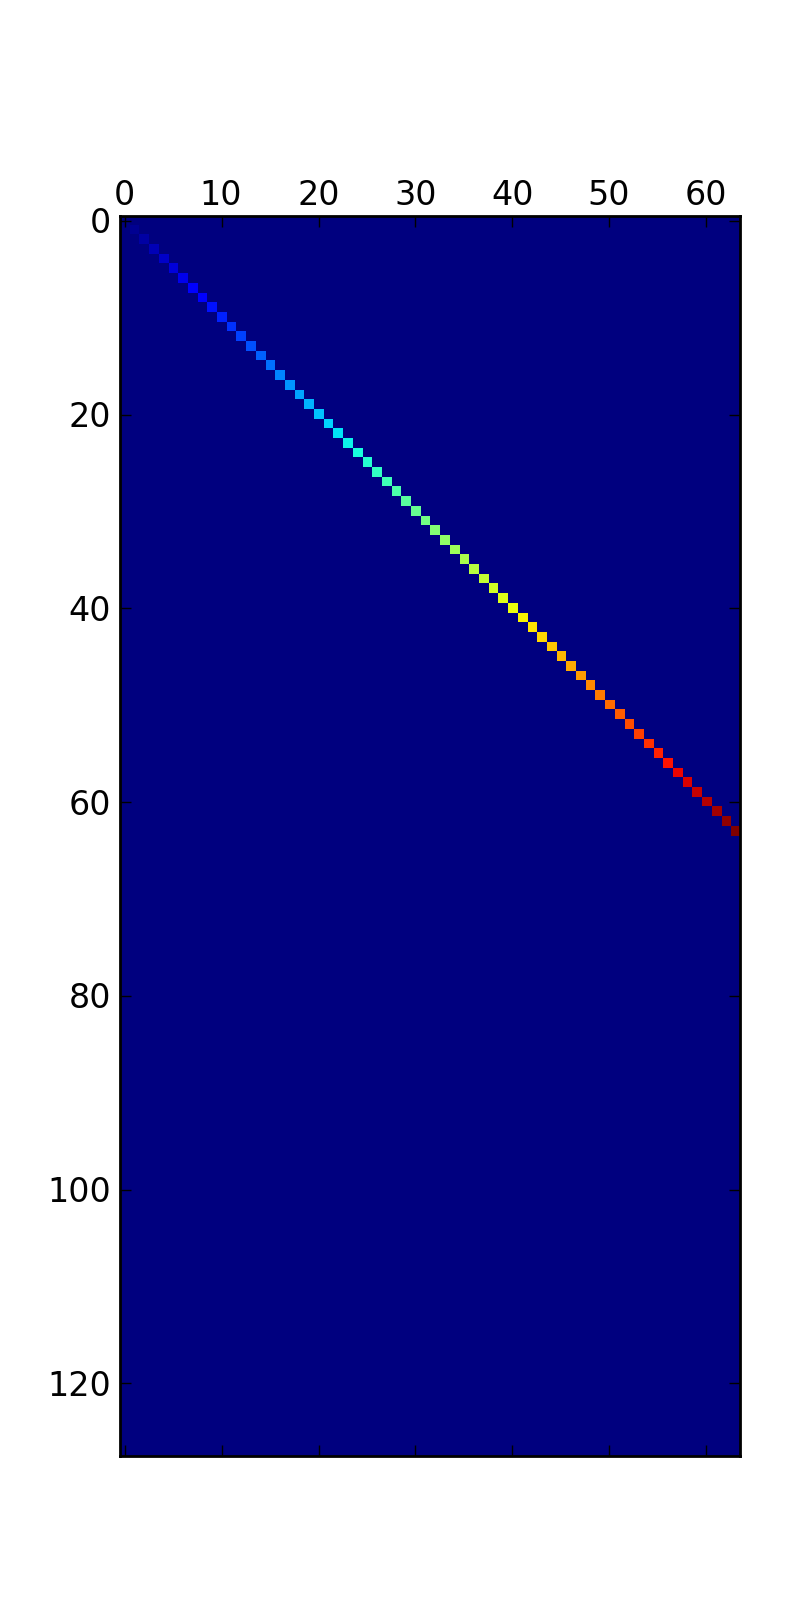
def samplemat(dims):
"""Make a matrix with all zeros and increasing elements on the diagonal"""
aa = zeros(dims)
for i in range(min(dims)):
aa[i,i] = i
return aa
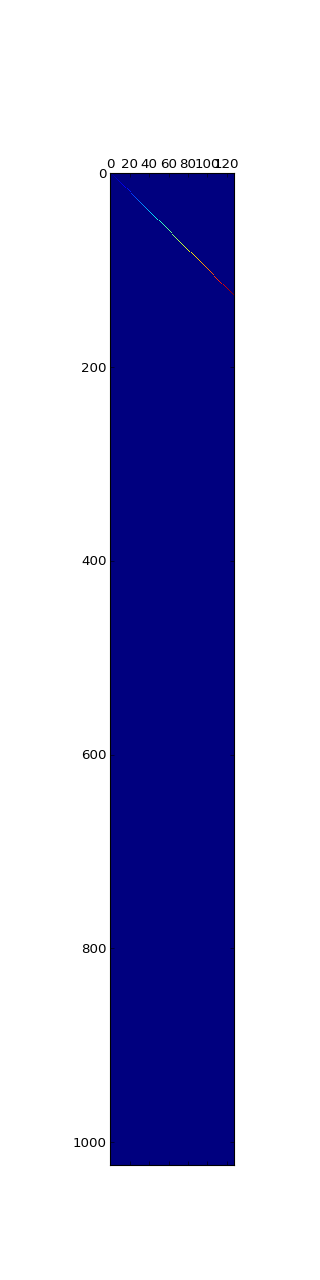
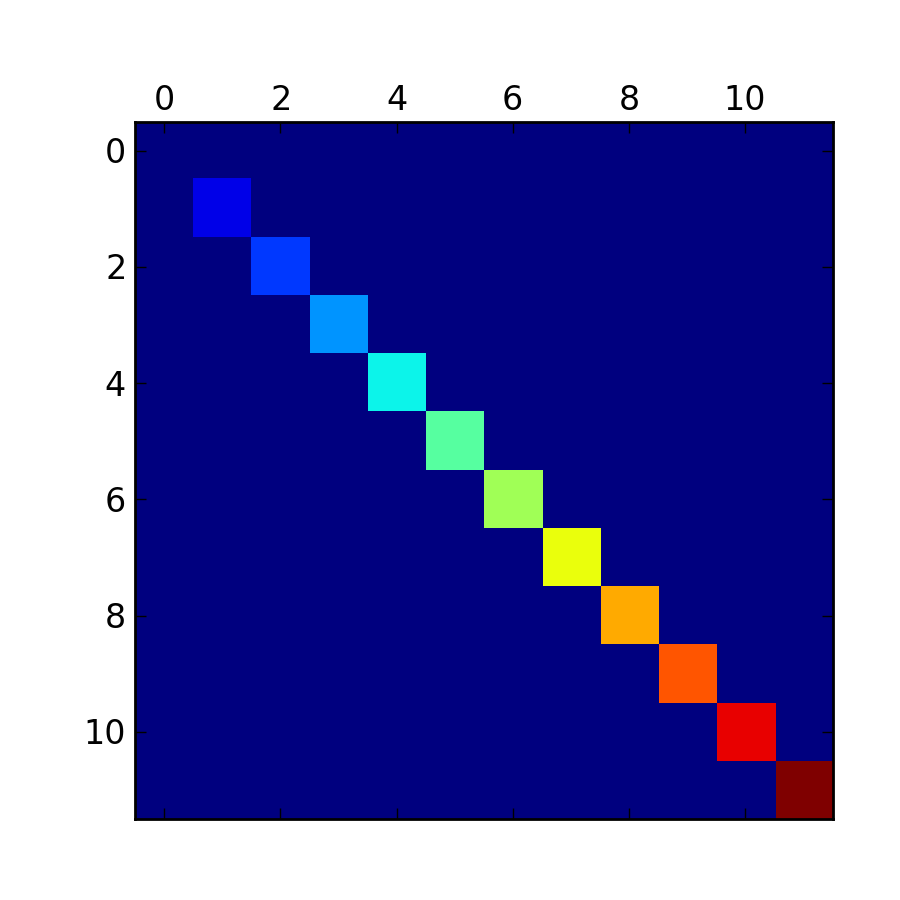
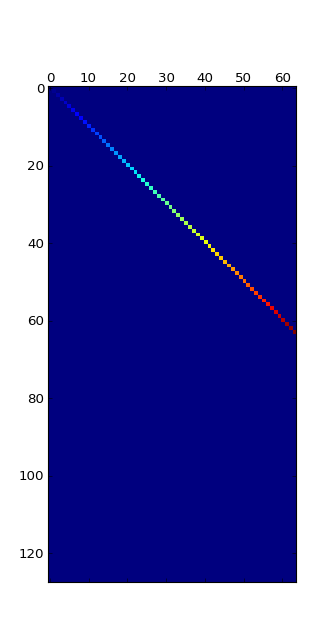
# Make a few matrices of strange sizes
dimlist = [(12,12),(128,64),(64,512),(1024,128)]
for d in dimlist:
matshow(samplemat(d))
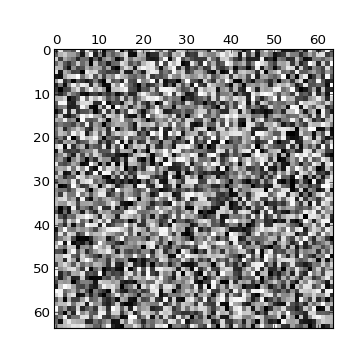
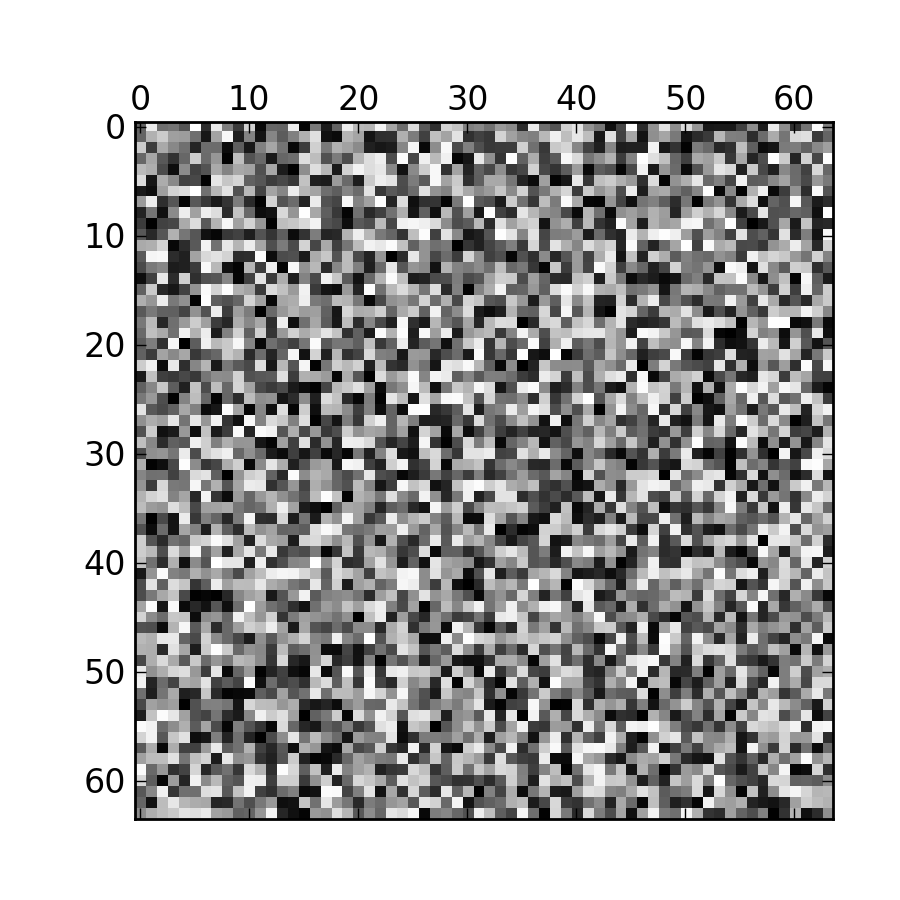
# Display a random matrix with a specified figure number and a grayscale colormap
matshow(rand(64,64),fignum=100,cmap=cm.gray)
show()
Keywords: python, matplotlib, pylab, example, codex (see Search examples)


