
(Source code, png, hires.png, pdf)

import matplotlib.pyplot as plt
import matplotlib.path as mpath
import numpy as np
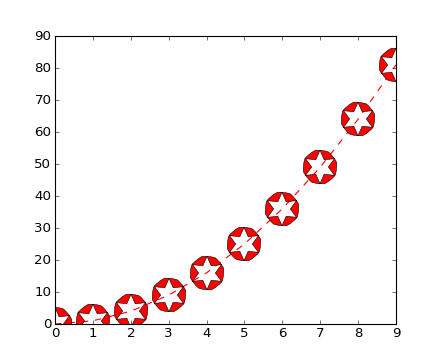
star = mpath.Path.unit_regular_star(6)
circle = mpath.Path.unit_circle()
# concatenate the star with an internal cutout of the circle
verts = np.concatenate([star.vertices, circle.vertices[::-1, ...]])
codes = np.concatenate([star.codes, circle.codes])
cut_star = mpath.Path(verts, codes)
plt.plot(np.arange(10)**2, '--r', marker=cut_star, markersize=15)
plt.show()
Keywords: python, matplotlib, pylab, example, codex (see Search examples)