
(Source code, png, hires.png, pdf)

#!/usr/bin/env python
import matplotlib
matplotlib.rcParams['legend.fancybox'] = True
import matplotlib.pyplot as plt
import numpy as np
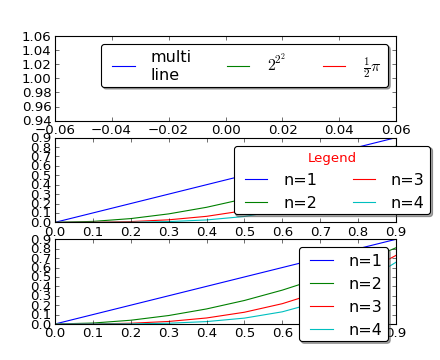
def myplot(ax):
t1 = np.arange(0.0, 1.0, 0.1)
for n in [1, 2, 3, 4]:
ax.plot(t1, t1**n, label="n=%d"%(n,))
ax1 = plt.subplot(3,1,1)
ax1.plot([1], label="multi\nline")
ax1.plot([1], label="$2^{2^2}$")
ax1.plot([1], label=r"$\frac{1}{2}\pi$")
ax1.legend(loc=1, ncol=3, shadow=True)
ax2 = plt.subplot(3,1,2)
myplot(ax2)
ax2.legend(loc="center left", bbox_to_anchor=[0.5, 0.5],
ncol=2, shadow=True, title="Legend")
ax2.get_legend().get_title().set_color("red")
ax3 = plt.subplot(3,1,3)
myplot(ax3)
ax3.legend(shadow=True, fancybox=True)
plt.draw()
plt.show()
Keywords: python, matplotlib, pylab, example, codex (see Search examples)