
(Source code, png, hires.png, pdf)
#!/usr/bin/env python
# Thanks to Charles Twardy for this example
#
#See http://matplotlib.sf.net/examples/legend_demo2.py for an example
#controlling which lines the legend uses and the order
import numpy as np
import matplotlib.pyplot as plt
a = np.arange(0,3,.02)
b = np.arange(0,3,.02)
c = np.exp(a)
d = c[::-1]
ax = plt.subplot(111)
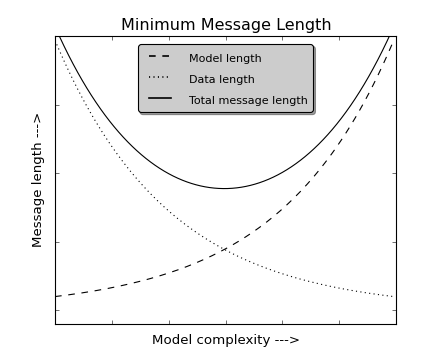
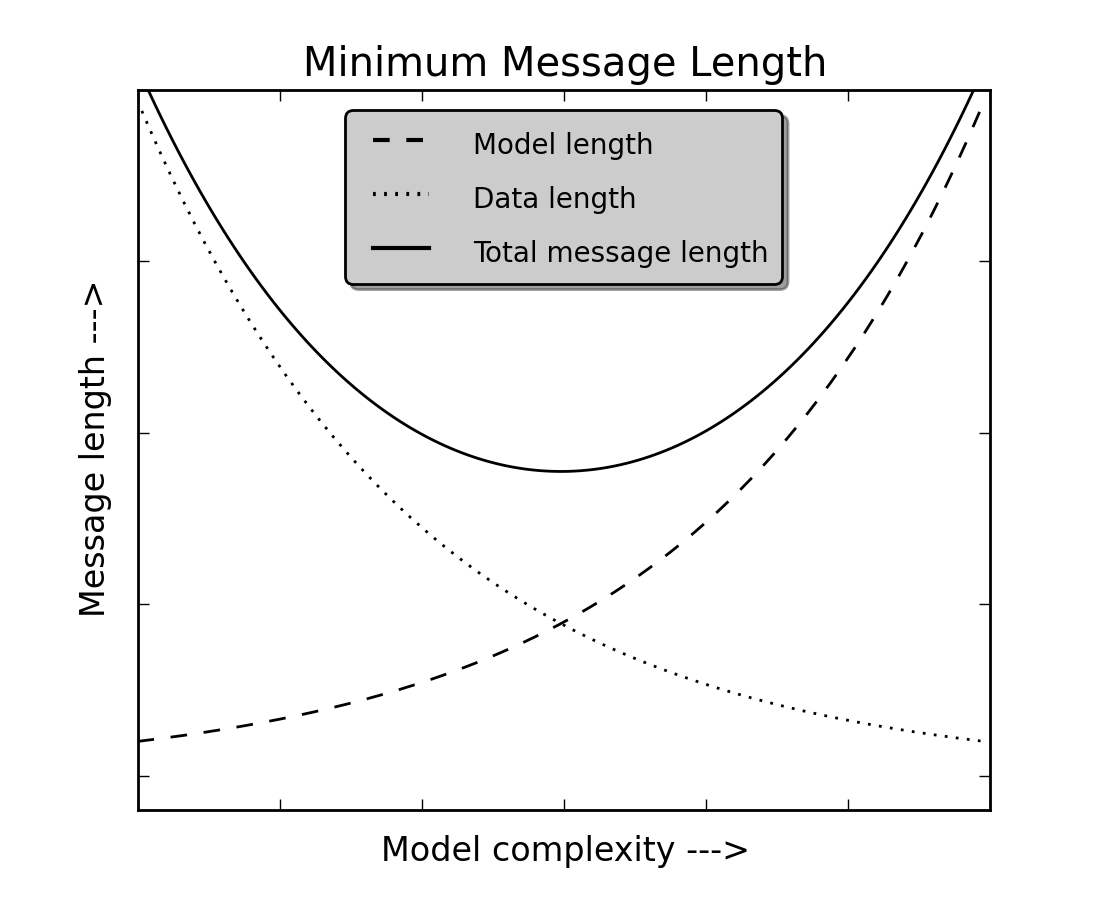
plt.plot(a,c,'k--',a,d,'k:',a,c+d,'k')
plt.legend(('Model length', 'Data length', 'Total message length'),
'upper center', shadow=True, fancybox=True)
plt.ylim([-1,20])
plt.grid(False)
plt.xlabel('Model complexity --->')
plt.ylabel('Message length --->')
plt.title('Minimum Message Length')
plt.setp(plt.gca(), 'yticklabels', [])
plt.setp(plt.gca(), 'xticklabels', [])
# set some legend properties. All the code below is optional. The
# defaults are usually sensible but if you need more control, this
# shows you how
leg = plt.gca().get_legend()
ltext = leg.get_texts() # all the text.Text instance in the legend
llines = leg.get_lines() # all the lines.Line2D instance in the legend
frame = leg.get_frame() # the patch.Rectangle instance surrounding the legend
# see text.Text, lines.Line2D, and patches.Rectangle for more info on
# the settable properties of lines, text, and rectangles
frame.set_facecolor('0.80') # set the frame face color to light gray
plt.setp(ltext, fontsize='small') # the legend text fontsize
plt.setp(llines, linewidth=1.5) # the legend linewidth
#leg.draw_frame(False) # don't draw the legend frame
plt.show()
Keywords: python, matplotlib, pylab, example, codex (see Search examples)