
(Source code, png, hires.png, pdf)
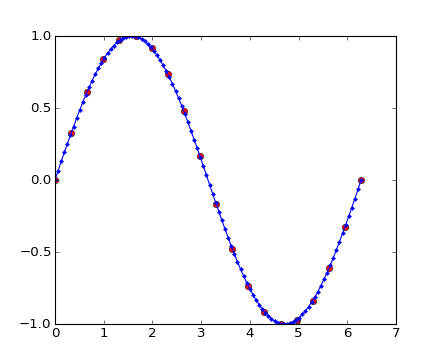
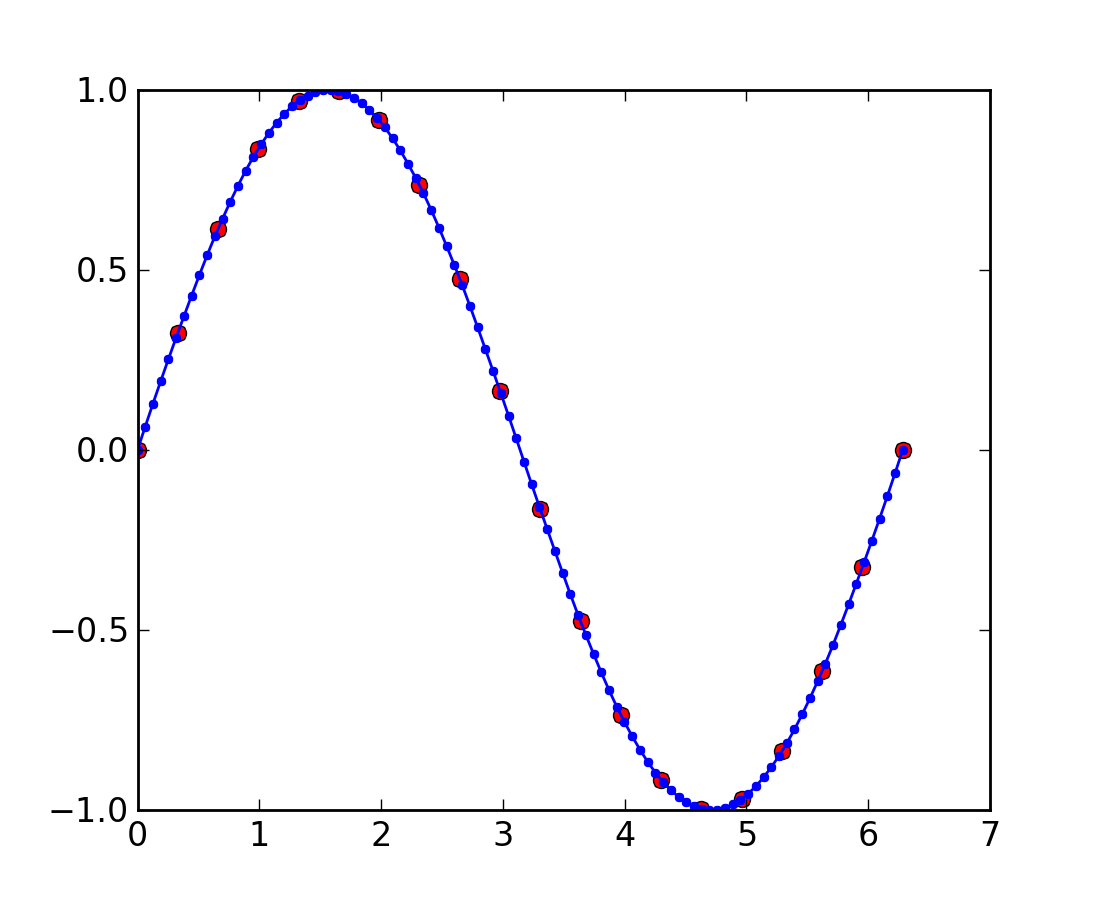
from matplotlib.pyplot import figure, show
from numpy import pi, sin, linspace
from matplotlib.mlab import stineman_interp

x = linspace(0,2*pi,20);
y = sin(x); yp = None
xi = linspace(x[0],x[-1],100);
yi = stineman_interp(xi,x,y,yp);

fig = figure()
ax = fig.add_subplot(111)
ax.plot(x,y,'ro',xi,yi,'-b.')
show()
Keywords: python, matplotlib, pylab, example, codex (see Search examples)