
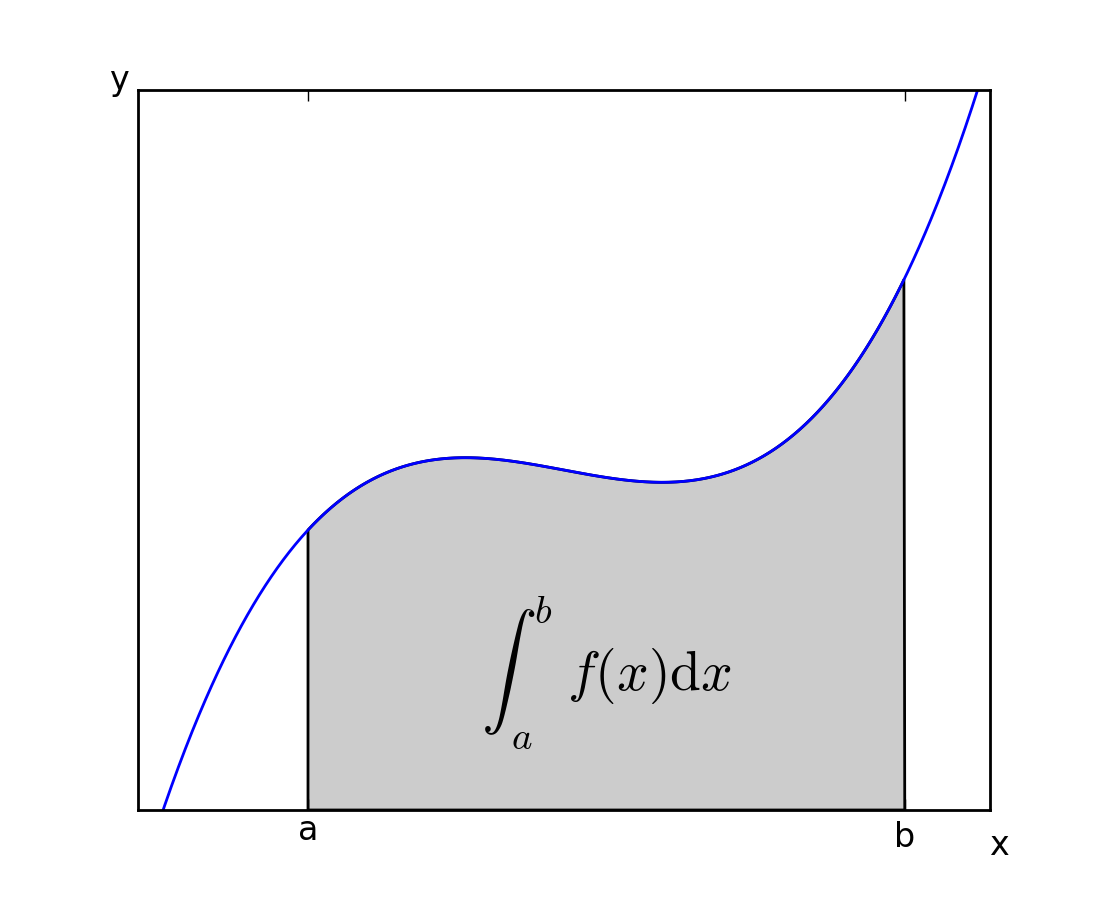
(Source code, png, hires.png, pdf)
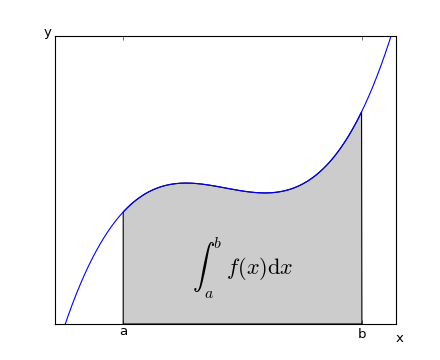
#!/usr/bin/env python

# implement the example graphs/integral from pyx
from pylab import *
from matplotlib.patches import Polygon

def func(x):
    return (x-3)*(x-5)*(x-7)+85

ax = subplot(111)

a, b = 2, 9 # integral area
x = arange(0, 10, 0.01)
y = func(x)
plot(x, y, linewidth=1)

# make the shaded region
ix = arange(a, b, 0.01)
iy = func(ix)
verts = [(a,0)] + list(zip(ix,iy)) + [(b,0)]
poly = Polygon(verts, facecolor='0.8', edgecolor='k')
ax.add_patch(poly)

text(0.5 * (a + b), 30,
     r"$\int_a^b f(x)\mathrm{d}x$", horizontalalignment='center',
     fontsize=20)

axis([0,10, 0, 180])
figtext(0.9, 0.05, 'x')
figtext(0.1, 0.9, 'y')
ax.set_xticks((a,b))
ax.set_xticklabels(('a','b'))
ax.set_yticks([])
show()
Keywords: python, matplotlib, pylab, example, codex (see Search examples)