
(Source code, png, hires.png, pdf)
#!/usr/bin/env python
import numpy as np
import matplotlib.pyplot as plt
def f(t):
s1 = np.sin(2*np.pi*t)
e1 = np.exp(-t)
return np.absolute((s1*e1))+.05
t = np.arange(0.0, 5.0, 0.1)
s = f(t)
nse = np.random.normal(0.0, 0.3, t.shape) * s
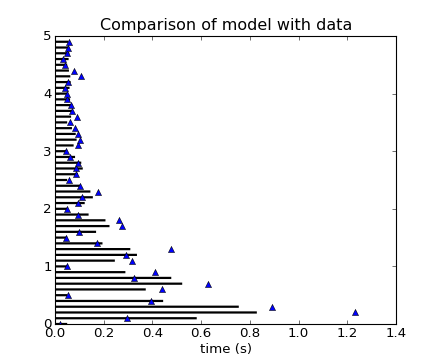
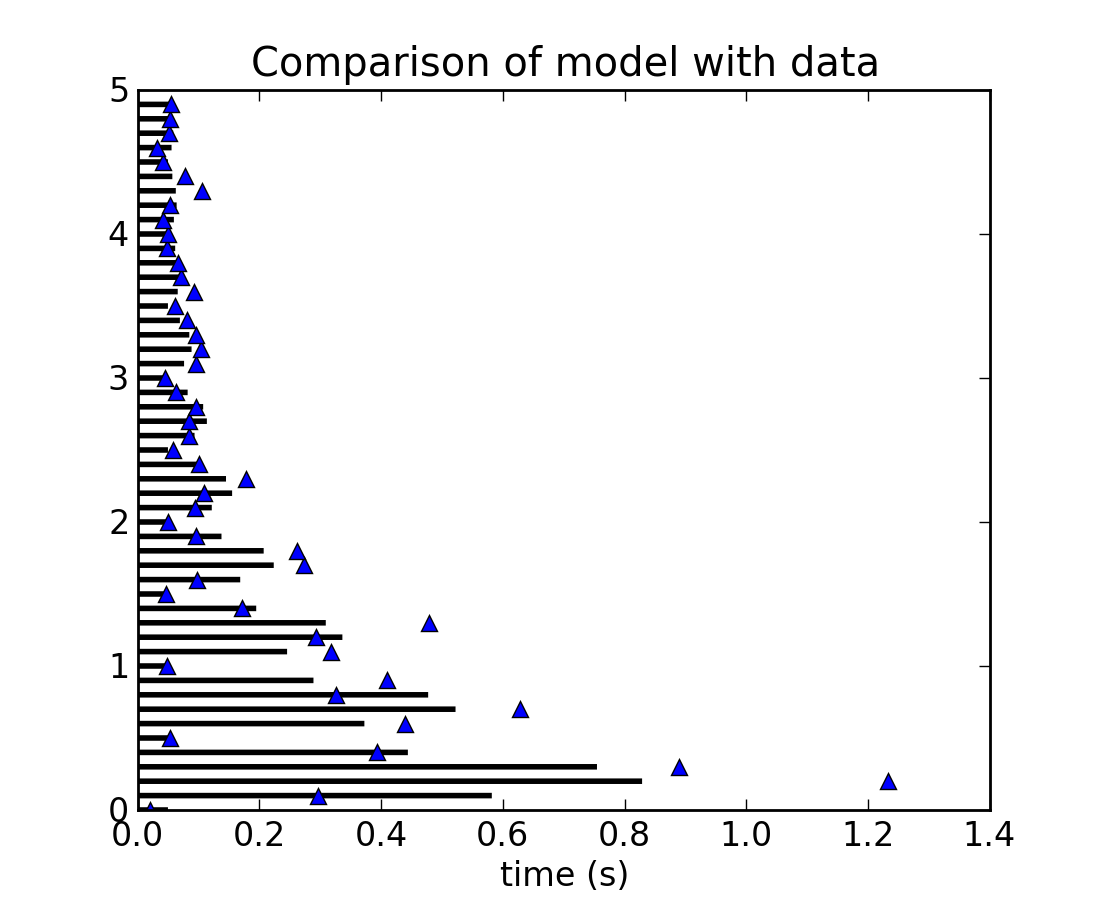
plt.plot(s+nse, t, 'b^')
plt.hlines(t, [0], s, lw=2)
plt.xlabel('time (s)')
plt.title('Comparison of model with data')
plt.xlim(xmin=0)
plt.show()
Keywords: python, matplotlib, pylab, example, codex (see Search examples)