
(Source code, png, hires.png, pdf)
#!/usr/bin/env python
import numpy as np
import matplotlib.pyplot as plt
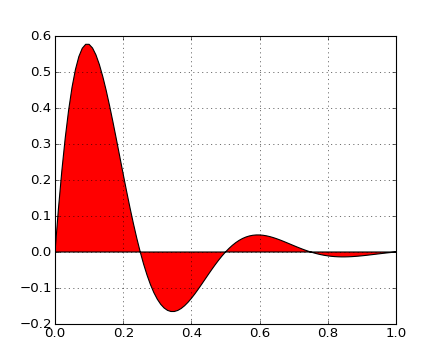
t = np.arange(0.0, 1.01, 0.01)
s = np.sin(2*2*np.pi*t)
plt.fill(t, s*np.exp(-5*t), 'r')
plt.grid(True)
plt.show()
Keywords: python, matplotlib, pylab, example, codex (see Search examples)