
(Source code, png, hires.png, pdf)
from mpl_toolkits.mplot3d import Axes3D
import matplotlib.pyplot as plt
fig = plt.figure()
ax = fig.gca(projection='3d')
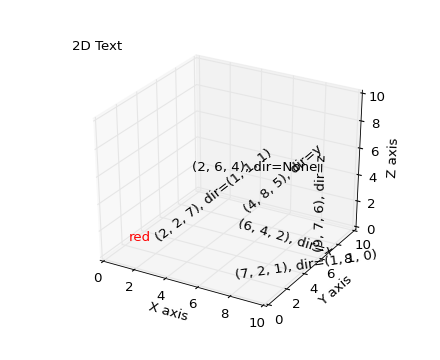
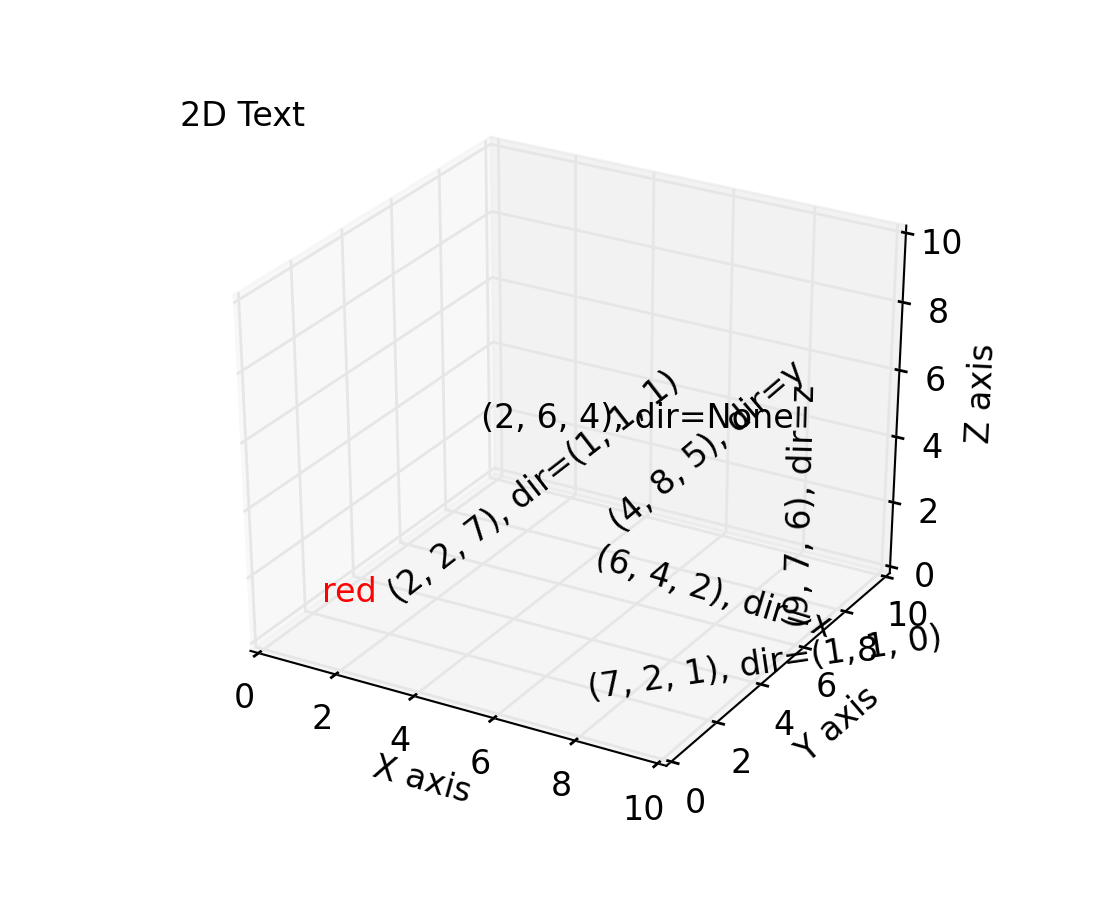
zdirs = (None, 'x', 'y', 'z', (1, 1, 0), (1, 1, 1))
xs = (2, 6, 4, 9, 7, 2)
ys = (6, 4, 8, 7, 2, 2)
zs = (4, 2, 5, 6, 1, 7)
for zdir, x, y, z in zip(zdirs, xs, ys, zs):
label = '(%d, %d, %d), dir=%s' % (x, y, z, zdir)
ax.text(x, y, z, label, zdir)
ax.text(1, 1, 1, "red", color='red')
ax.text2D(0.05, 0.95, "2D Text", transform=ax.transAxes)
ax.set_xlim3d(0, 10)
ax.set_ylim3d(0, 10)
ax.set_zlim3d(0, 10)
ax.set_xlabel('X axis')
ax.set_ylabel('Y axis')
ax.set_zlabel('Z axis')
plt.show()
Keywords: python, matplotlib, pylab, example, codex (see Search examples)