
(Source code, png, hires.png, pdf)
import matplotlib.pyplot as plt
from mpl_toolkits.axes_grid1 import AxesGrid
def get_demo_image():
import numpy as np
from matplotlib.cbook import get_sample_data
f = get_sample_data("axes_grid/bivariate_normal.npy", asfileobj=False)
z = np.load(f)
# z is a numpy array of 15x15
return z, (-3,4,-4,3)
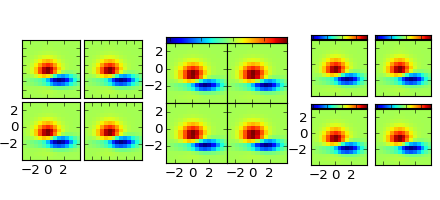
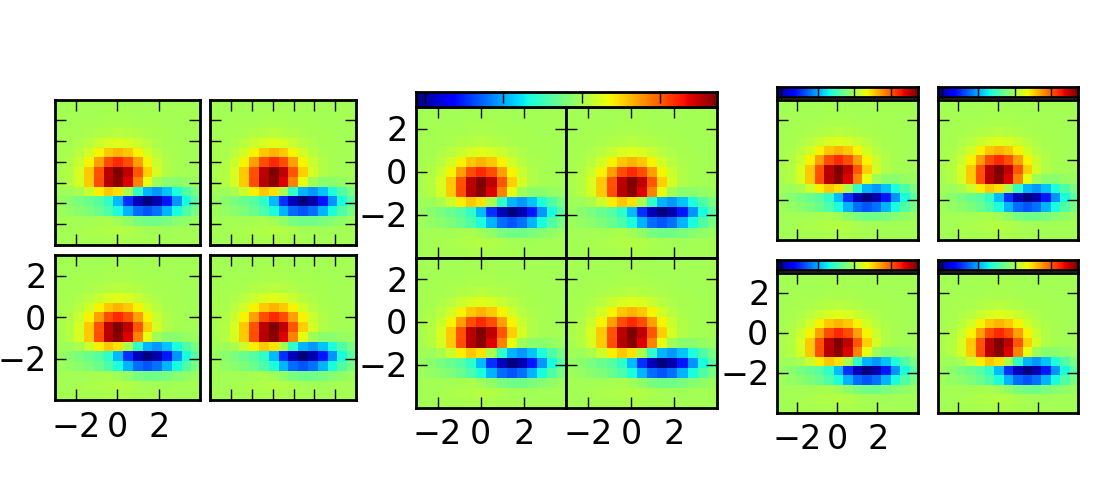
def demo_simple_grid(fig):
"""
A grid of 2x2 images with 0.05 inch pad between images and only
the lower-left axes is labeled.
"""
grid = AxesGrid(fig, 131, # similar to subplot(131)
nrows_ncols = (2, 2),
axes_pad = 0.05,
label_mode = "1",
)
Z, extent = get_demo_image()
for i in range(4):
im = grid[i].imshow(Z, extent=extent, interpolation="nearest")
# This only affects axes in first column and second row as share_all = False.
grid.axes_llc.set_xticks([-2, 0, 2])
grid.axes_llc.set_yticks([-2, 0, 2])
def demo_grid_with_single_cbar(fig):
"""
A grid of 2x2 images with a single colorbar
"""
grid = AxesGrid(fig, 132, # similar to subplot(132)
nrows_ncols = (2, 2),
axes_pad = 0.0,
share_all=True,
label_mode = "L",
cbar_location = "top",
cbar_mode="single",
)
Z, extent = get_demo_image()
for i in range(4):
im = grid[i].imshow(Z, extent=extent, interpolation="nearest")
#plt.colorbar(im, cax = grid.cbar_axes[0])
grid.cbar_axes[0].colorbar(im)
for cax in grid.cbar_axes:
cax.toggle_label(False)
# This affects all axes as share_all = True.
grid.axes_llc.set_xticks([-2, 0, 2])
grid.axes_llc.set_yticks([-2, 0, 2])
def demo_grid_with_each_cbar(fig):
"""
A grid of 2x2 images. Each image has its own colorbar.
"""
grid = AxesGrid(F, 133, # similar to subplot(122)
nrows_ncols = (2, 2),
axes_pad = 0.1,
label_mode = "1",
share_all = True,
cbar_location="top",
cbar_mode="each",
cbar_size="7%",
cbar_pad="2%",
)
Z, extent = get_demo_image()
for i in range(4):
im = grid[i].imshow(Z, extent=extent, interpolation="nearest")
grid.cbar_axes[i].colorbar(im)
for cax in grid.cbar_axes:
cax.toggle_label(False)
# This affects all axes because we set share_all = True.
grid.axes_llc.set_xticks([-2, 0, 2])
grid.axes_llc.set_yticks([-2, 0, 2])
if 1:
F = plt.figure(1, (5.5, 2.5))
F.subplots_adjust(left=0.05, right=0.98)
demo_simple_grid(F)
demo_grid_with_single_cbar(F)
demo_grid_with_each_cbar(F)
plt.draw()
plt.show()
Keywords: python, matplotlib, pylab, example, codex (see Search examples)