
(Source code, png, hires.png, pdf)

import numpy as np
import matplotlib.path as mpath
import matplotlib.patches as mpatches
import matplotlib.pyplot as plt
Path = mpath.Path
fig = plt.figure()
ax = fig.add_subplot(111)
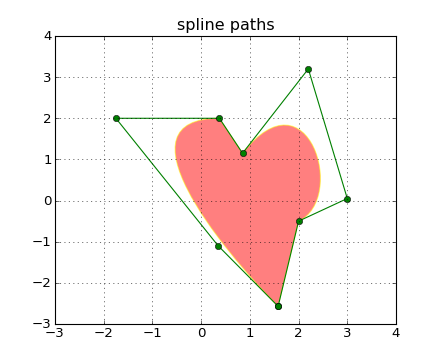
pathdata = [
(Path.MOVETO, (1.58, -2.57)),
(Path.CURVE4, (0.35, -1.1)),
(Path.CURVE4, (-1.75, 2.0)),
(Path.CURVE4, (0.375, 2.0)),
(Path.LINETO, (0.85, 1.15)),
(Path.CURVE4, (2.2, 3.2)),
(Path.CURVE4, (3, 0.05)),
(Path.CURVE4, (2.0, -0.5)),
(Path.CLOSEPOLY, (1.58, -2.57)),
]
codes, verts = zip(*pathdata)
path = mpath.Path(verts, codes)
patch = mpatches.PathPatch(path, facecolor='red', edgecolor='yellow', alpha=0.5)
ax.add_patch(patch)
x, y = zip(*path.vertices)
line, = ax.plot(x, y, 'go-')
ax.grid()
ax.set_xlim(-3,4)
ax.set_ylim(-3,4)
ax.set_title('spline paths')
plt.show()
Keywords: python, matplotlib, pylab, example, codex (see Search examples)