
(Source code, png, hires.png, pdf)

#!/usr/bin/env python
"""
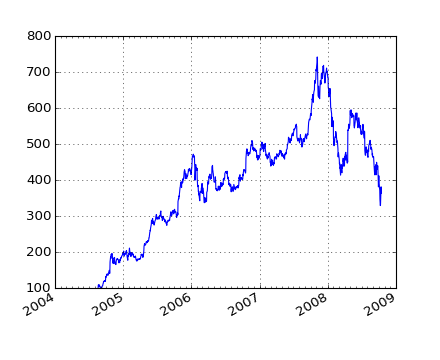
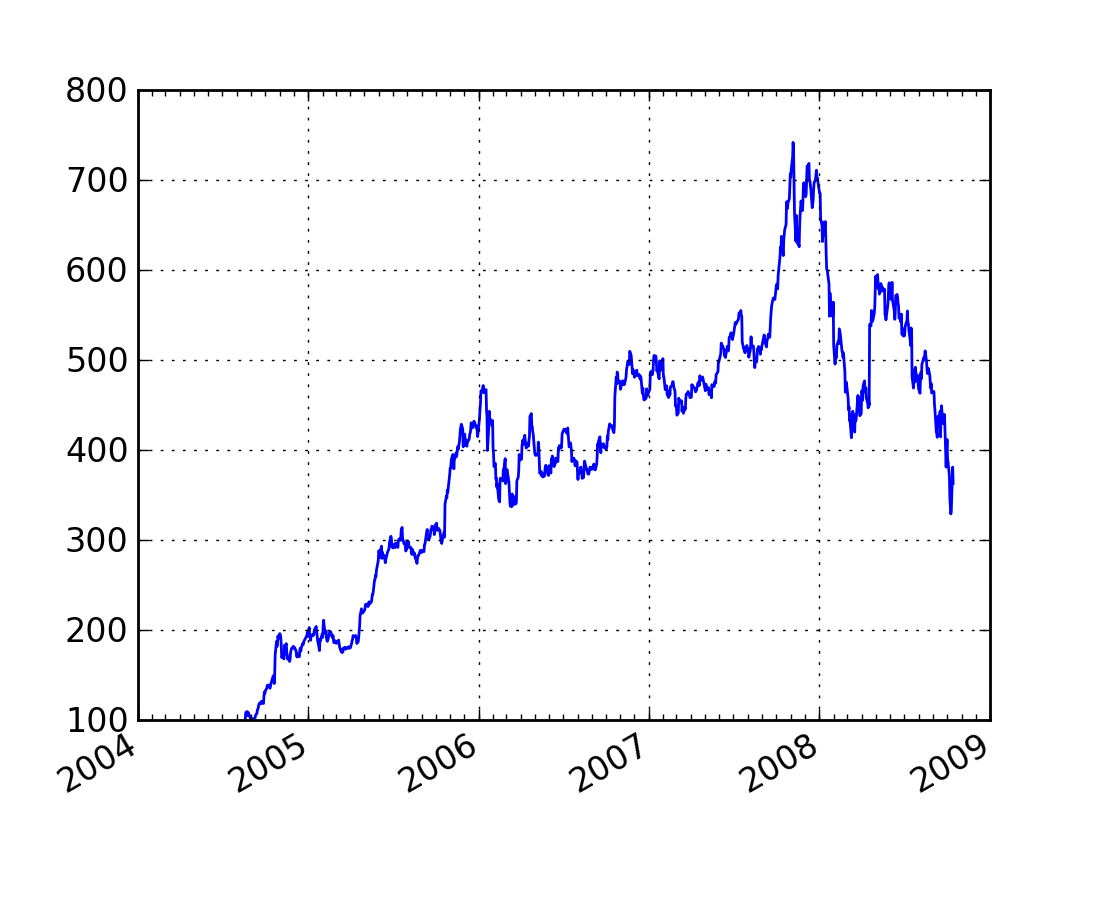
Show how to make date plots in matplotlib using date tick locators and
formatters. See major_minor_demo1.py for more information on
controlling major and minor ticks
All matplotlib date plotting is done by converting date instances into
days since the 0001-01-01 UTC. The conversion, tick locating and
formatting is done behind the scenes so this is most transparent to
you. The dates module provides several converter functions date2num
and num2date
"""
import datetime
import numpy as np
import matplotlib.pyplot as plt
import matplotlib.dates as mdates
import matplotlib.cbook as cbook
years = mdates.YearLocator() # every year
months = mdates.MonthLocator() # every month
yearsFmt = mdates.DateFormatter('%Y')
# load a numpy record array from yahoo csv data with fields date,
# open, close, volume, adj_close from the mpl-data/example directory.
# The record array stores python datetime.date as an object array in
# the date column
datafile = cbook.get_sample_data('goog.npy')
r = np.load(datafile).view(np.recarray)
fig = plt.figure()
ax = fig.add_subplot(111)
ax.plot(r.date, r.adj_close)
# format the ticks
ax.xaxis.set_major_locator(years)
ax.xaxis.set_major_formatter(yearsFmt)
ax.xaxis.set_minor_locator(months)
datemin = datetime.date(r.date.min().year, 1, 1)
datemax = datetime.date(r.date.max().year+1, 1, 1)
ax.set_xlim(datemin, datemax)
# format the coords message box
def price(x): return '$%1.2f'%x
ax.format_xdata = mdates.DateFormatter('%Y-%m-%d')
ax.format_ydata = price
ax.grid(True)
# rotates and right aligns the x labels, and moves the bottom of the
# axes up to make room for them
fig.autofmt_xdate()
plt.show()
Keywords: python, matplotlib, pylab, example, codex (see Search examples)