
(Source code, png, hires.png, pdf)

"""
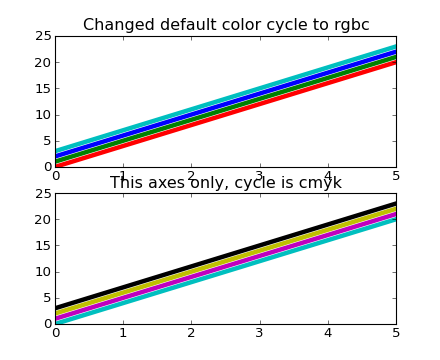
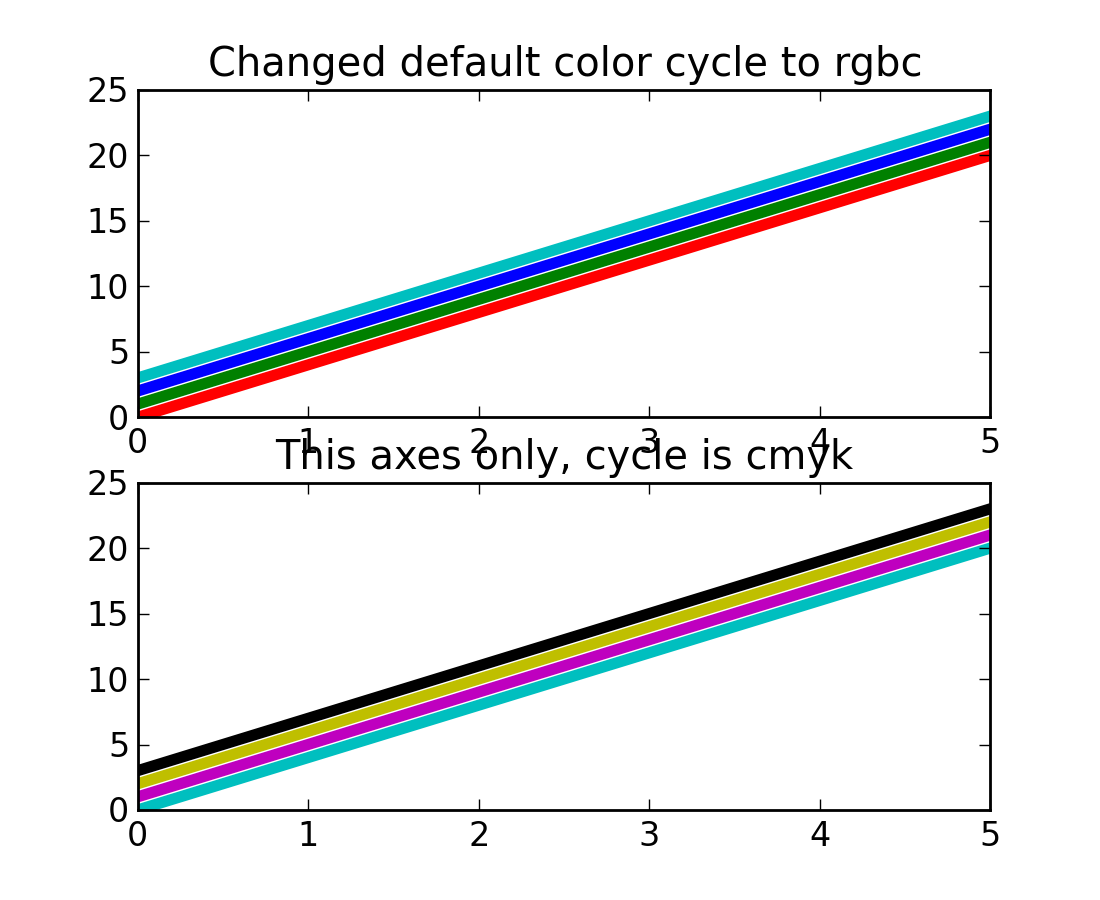
Illustrate the API for changing the cycle of colors used
when plotting multiple lines on a single Axes.
"""
import numpy as np
import matplotlib.pyplot as plt
import matplotlib as mpl
yy = np.arange(24)
yy.shape = 6,4
mpl.rc('lines', linewidth=4)
fig = plt.figure()
mpl.rcParams['axes.color_cycle'] = ['r', 'g', 'b', 'c']
ax = fig.add_subplot(2,1,1)
ax.plot(yy)
ax.set_title('Changed default color cycle to rgbc')
ax = fig.add_subplot(2,1,2)
ax.set_color_cycle(['c', 'm', 'y', 'k'])
ax.plot(yy)
ax.set_title('This axes only, cycle is cmyk')
plt.show()
Keywords: python, matplotlib, pylab, example, codex (see Search examples)