Learn what to expect in the new updates

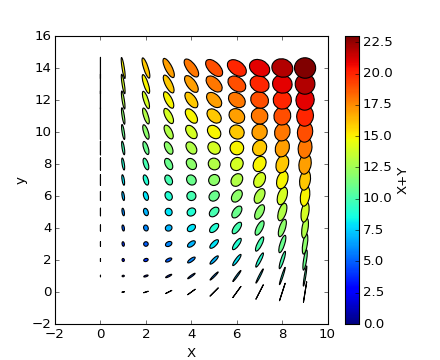
(Source code, png, hires.png, pdf)

import matplotlib.pyplot as plt
import numpy as np
from matplotlib.collections import EllipseCollection

x = np.arange(10)
y = np.arange(15)
X, Y = np.meshgrid(x, y)

XY = np.hstack((X.ravel()[:,np.newaxis], Y.ravel()[:,np.newaxis]))

ww = X/10.0
hh = Y/15.0
aa = X*9


fig, ax = plt.subplots()

ec = EllipseCollection(
                        ww,
                        hh,
                        aa,
                        units='x',
                        offsets=XY,
                        transOffset=ax.transData)
ec.set_array((X+Y).ravel())
ax.add_collection(ec)
ax.autoscale_view()
ax.set_xlabel('X')
ax.set_ylabel('y')
cbar = plt.colorbar(ec)
cbar.set_label('X+Y')
plt.show()
Keywords: python, matplotlib, pylab, example, codex (see Search examples)