Learn what to expect in the new updates

(Source code, png, hires.png, pdf)
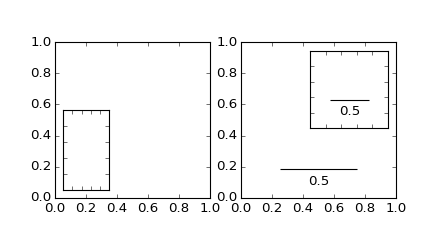
import matplotlib.pyplot as plt

from mpl_toolkits.axes_grid1.inset_locator import inset_axes, zoomed_inset_axes
from mpl_toolkits.axes_grid1.anchored_artists import AnchoredSizeBar


def add_sizebar(ax, size):
   asb =  AnchoredSizeBar(ax.transData,
                         size,
                         str(size),
                         loc=8,
                         pad=0.1, borderpad=0.5, sep=5,
                         frameon=False)
   ax.add_artist(asb)


fig, (ax, ax2) = plt.subplots(1, 2, figsize=[5.5, 3])

# first subplot
ax.set_aspect(1.)

axins = inset_axes(ax,
                   width="30%", # width = 30% of parent_bbox
                   height=1., # height : 1 inch
                   loc=3)

plt.xticks(visible=False)
plt.yticks(visible=False)


# second subplot
ax2.set_aspect(1.)

axins = zoomed_inset_axes(ax2, 0.5, loc=1) # zoom = 0.5

plt.xticks(visible=False)
plt.yticks(visible=False)

add_sizebar(ax2, 0.5)
add_sizebar(axins, 0.5)

plt.draw()
plt.show()
Keywords: python, matplotlib, pylab, example, codex (see Search examples)