Learn what to expect in the new updates

(Source code, png, hires.png, pdf)
import numpy as np
import matplotlib.pyplot as plt
# Make some fake data.
a = b = np.arange(0,3, .02)
c = np.exp(a)
d = c[::-1]
# Create plots with pre-defined labels.
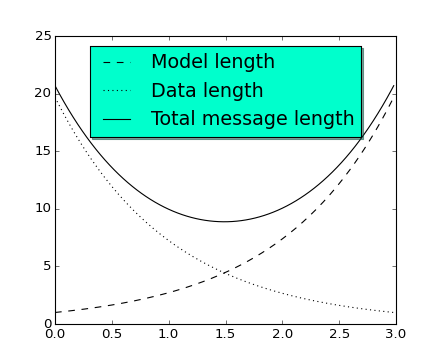
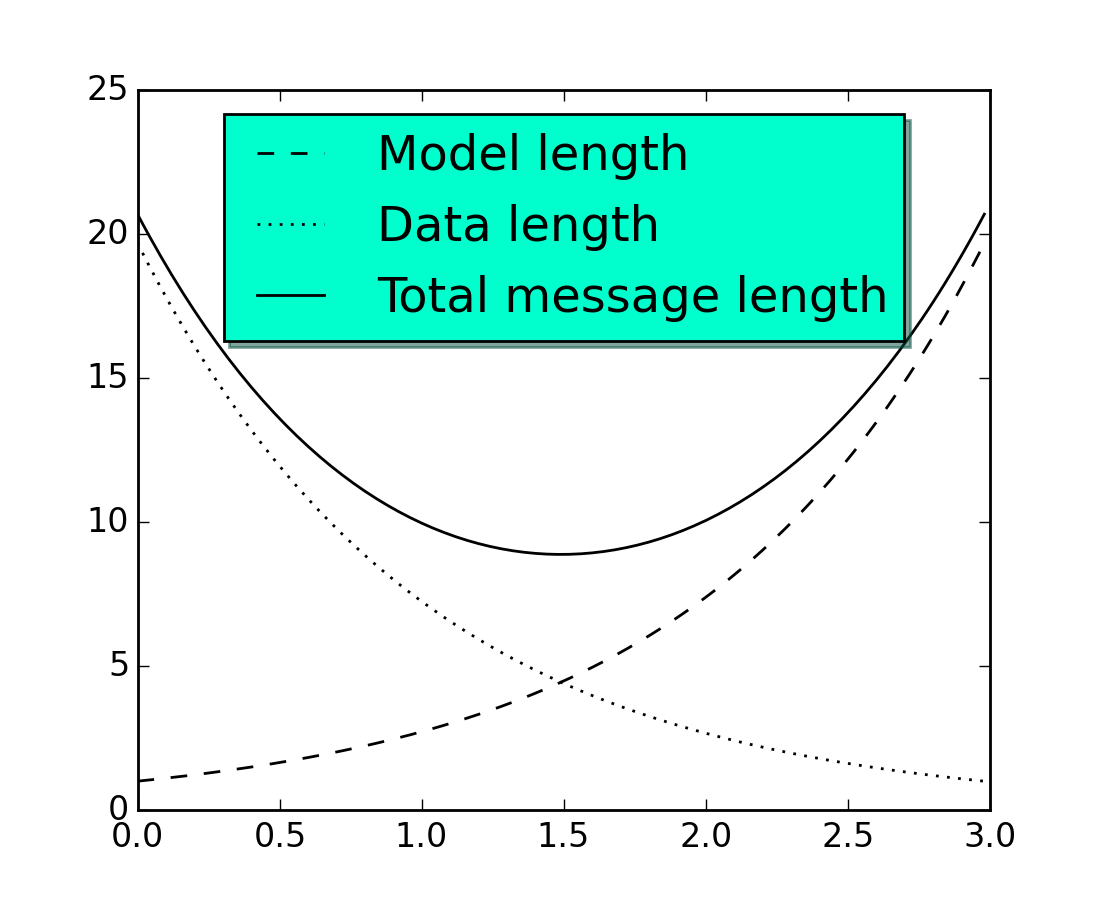
plt.plot(a, c, 'k--', label='Model length')
plt.plot(a, d, 'k:', label='Data length')
plt.plot(a, c+d, 'k', label='Total message length')
legend = plt.legend(loc='upper center', shadow=True, fontsize='x-large')
# Put a nicer background color on the legend.
legend.get_frame().set_facecolor('#00FFCC')
plt.show()
Keywords: python, matplotlib, pylab, example, codex (see Search examples)