
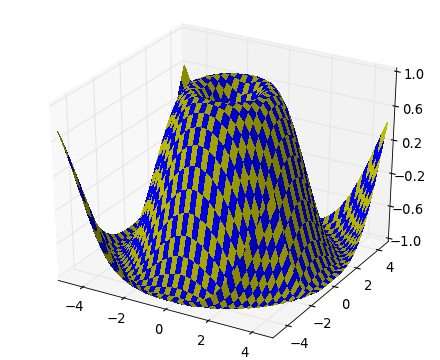
The mplot3d toolkit adds simple 3D plotting capabilities to matplotlib by supplying an axes object that can create a 2D projection of a 3D scene. The resulting graph will have the same look and feel as regular 2D plots.
The interactive backends also provide the ability to rotate and zoom the 3D scene. One can rotate the 3D scene by simply clicking-and-dragging the scene. Zooming is done by right-clicking the scene and dragging the mouse up and down. Note that one does not use the zoom button like one would use for regular 2D plots.