Interactive navigation
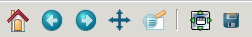
All figure windows come with a navigation toolbar, which can be used
to navigate through the data set. Here is a description of each of
the buttons at the bottom of the toolbar


- The Forward and Back buttons
- These are akin to the web browser forward and back buttons. They
are used to navigate back and forth between previously defined
views. They have no meaning unless you have already navigated
somewhere else using the pan and zoom buttons. This is analogous
to trying to click Back on your web browser before visiting a
new page –nothing happens. Home always takes you to the
first, default view of your data. For Home, Forward and
Back, think web browser where data views are web pages. Use
the pan and zoom to rectangle to define new views.

- The Pan/Zoom button
This button has two modes: pan and zoom. Click the toolbar button
to activate panning and zooming, then put your mouse somewhere
over an axes. Press the left mouse button and hold it to pan the
figure, dragging it to a new position. When you release it, the
data under the point where you pressed will be moved to the point
where you released. If you press ‘x’ or ‘y’ while panning the
motion will be constrained to the x or y axis, respectively. Press
the right mouse button to zoom, dragging it to a new position.
The x axis will be zoomed in proportionate to the rightward
movement and zoomed out proportionate to the leftward movement.
Ditto for the y axis and up/down motions. The point under your
mouse when you begin the zoom remains stationary, allowing you to
zoom to an arbitrary point in the figure. You can use the
modifier keys ‘x’, ‘y’ or ‘CONTROL’ to constrain the zoom to the x
axis, the y axis, or aspect ratio preserve, respectively.
With polar plots, the pan and zoom functionality behaves
differently. The radius axis labels can be dragged using the left
mouse button. The radius scale can be zoomed in and out using the
right mouse button.

- The Zoom-to-rectangle button
- Click this toolbar button to activate this mode. Put your mouse
somewhere over and axes and press the left mouse button. Drag the
mouse while holding the button to a new location and release. The
axes view limits will be zoomed to the rectangle you have defined.
There is also an experimental ‘zoom out to rectangle’ in this mode
with the right button, which will place your entire axes in the
region defined by the zoom out rectangle.

- The Subplot-configuration button
- Use this tool to configure the parameters of the subplot: the
left, right, top, bottom, space between the rows and space between
the columns.

- The Save button
- Click this button to launch a file save dialog. You can save
files with the following extensions: png, ps, eps,
svg and pdf.
Navigation Keyboard Shortcuts
The following table holds all the default keys, which can be overwritten by use of your matplotlibrc (#keymap.*).
| Command |
Keyboard Shortcut(s) |
|---|
| Home/Reset |
h or r or home |
| Back |
c or left arrow or backspace |
| Forward |
v or right arrow |
| Pan/Zoom |
p |
| Zoom-to-rect |
o |
| Save |
ctrl + s |
| Toggle fullscreen |
ctrl + f |
| Close plot |
ctrl + w |
| Constrain pan/zoom to x axis |
hold x when panning/zooming with mouse |
| Constrain pan/zoom to y axis |
hold y when panning/zooming with mouse |
| Preserve aspect ratio |
hold CONTROL when panning/zooming with mouse |
| Toggle grid |
g when mouse is over an axes |
| Toggle x axis scale (log/linear) |
L or k when mouse is over an axes |
| Toggle y axis scale (log/linear) |
l when mouse is over an axes |
If you are using matplotlib.pyplot the toolbar will be created
automatically for every figure. If you are writing your own user
interface code, you can add the toolbar as a widget. The exact syntax
depends on your UI, but we have examples for every supported UI in the
matplotlib/examples/user_interfaces directory. Here is some
example code for GTK:
from matplotlib.figure import Figure
from matplotlib.backends.backend_gtkagg import FigureCanvasGTKAgg as FigureCanvas
from matplotlib.backends.backend_gtkagg import NavigationToolbar2GTKAgg as NavigationToolbar

win = gtk.Window()
win.connect("destroy", lambda x: gtk.main_quit())
win.set_default_size(400,300)
win.set_title("Embedding in GTK")

vbox = gtk.VBox()
win.add(vbox)

fig = Figure(figsize=(5,4), dpi=100)
ax = fig.add_subplot(111)
ax.plot([1,2,3])

canvas = FigureCanvas(fig)  # a gtk.DrawingArea
vbox.pack_start(canvas)
toolbar = NavigationToolbar(canvas, win)
vbox.pack_start(toolbar, False, False)

win.show_all()
gtk.main()
