
(Source code, png, hires.png, pdf)
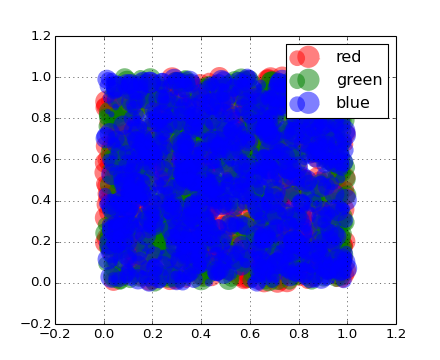
#!/usr/bin/env python
from pylab import *

N=1000

props = dict( alpha=0.5, edgecolors='none' )

handles = []
colours = ['red', 'green', 'blue', 'magenta', 'cyan', 'yellow']
colours = ['red', 'green', 'blue']
for colour in colours:
    x, y = rand(2,N)
    s = 400.0 * rand(N)
    handles.append(scatter(x, y, c=colour, s=s, **props))

legend(handles, colours)
grid(True)

show()
Keywords: python, matplotlib, pylab, example, codex (see Search examples)