
(Source code, png, hires.png, pdf)
#!/usr/bin/env python
"""
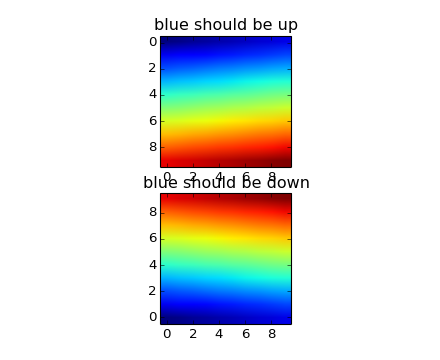
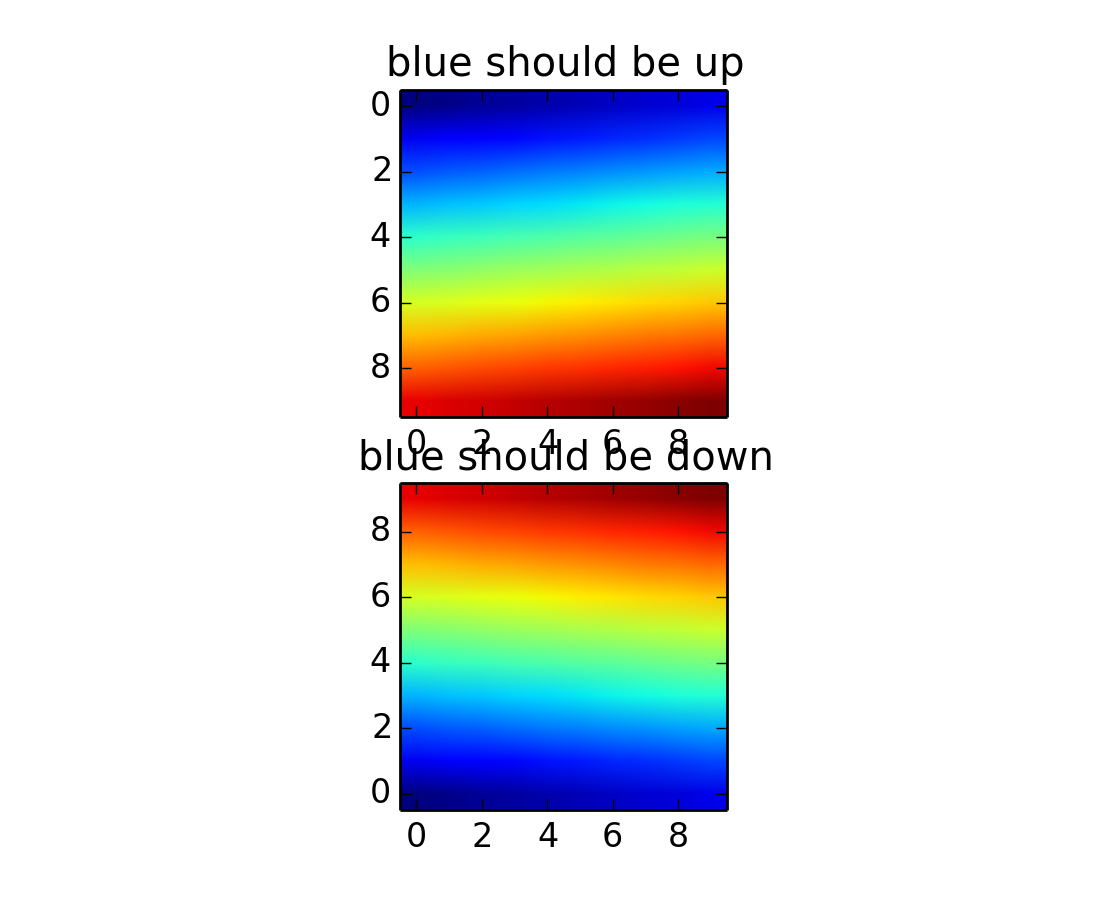
You can specify whether images should be plotted with the array origin
x[0,0] in the upper left or upper right by using the origin parameter.
You can also control the default be setting image.origin in your
matplotlibrc file; see http://matplotlib.org/matplotlibrc
"""
from pylab import *
x = arange(100.0); x.shape = 10,10
interp = 'bilinear';
#interp = 'nearest';
lim = -2,11,-2,6
subplot(211, axisbg='g')
title('blue should be up')
imshow(x, origin='upper', interpolation=interp)
#axis(lim)
subplot(212, axisbg='y')
title('blue should be down')
imshow(x, origin='lower', interpolation=interp)
#axis(lim)
show()
Keywords: python, matplotlib, pylab, example, codex (see Search examples)