
import itertools
import numpy as np
import matplotlib.lines as mlines
import matplotlib.pyplot as plt
colors = itertools.cycle(['b', 'g', 'r', 'c', 'm', 'y', 'k'])
altcolor = 'lightgreen'
plt.rcParams['text.usetex'] = False # otherwise, '^' will cause trouble
y = np.arange(10)
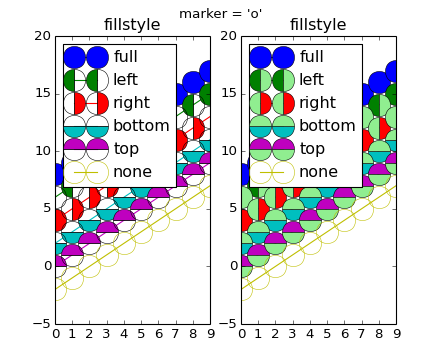
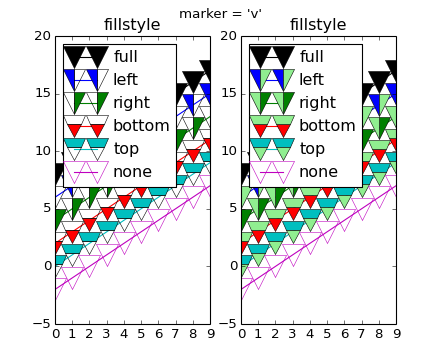
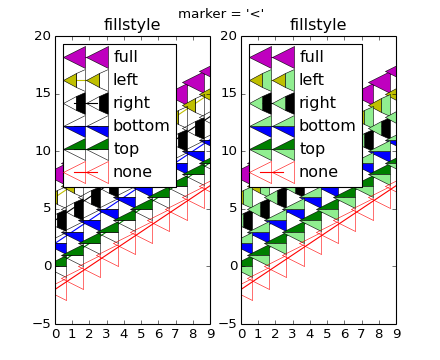
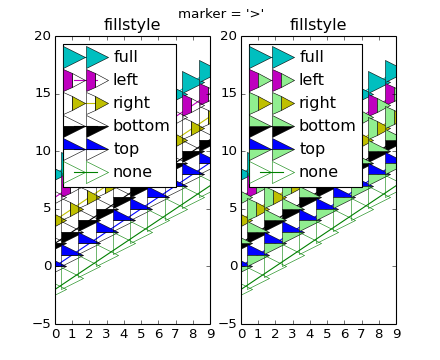
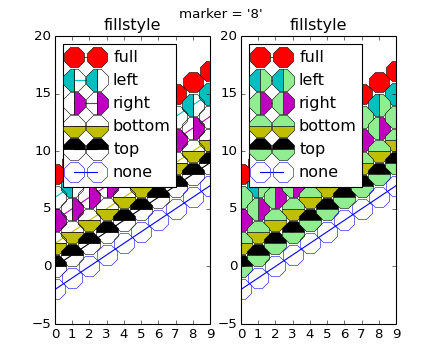
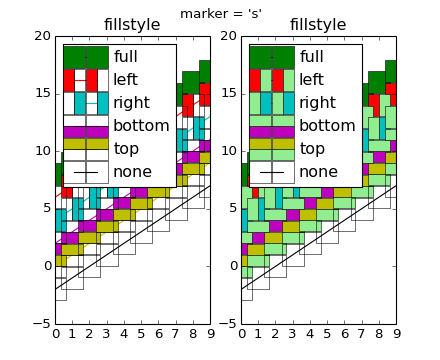
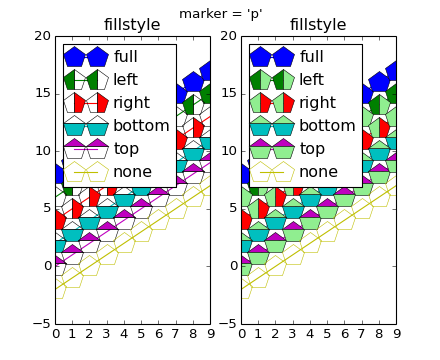
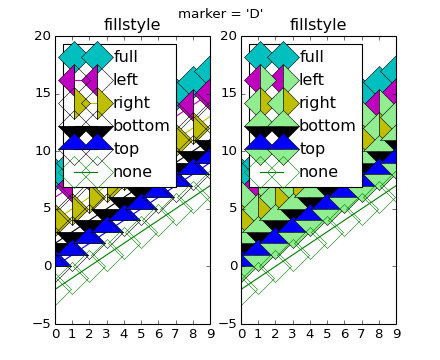
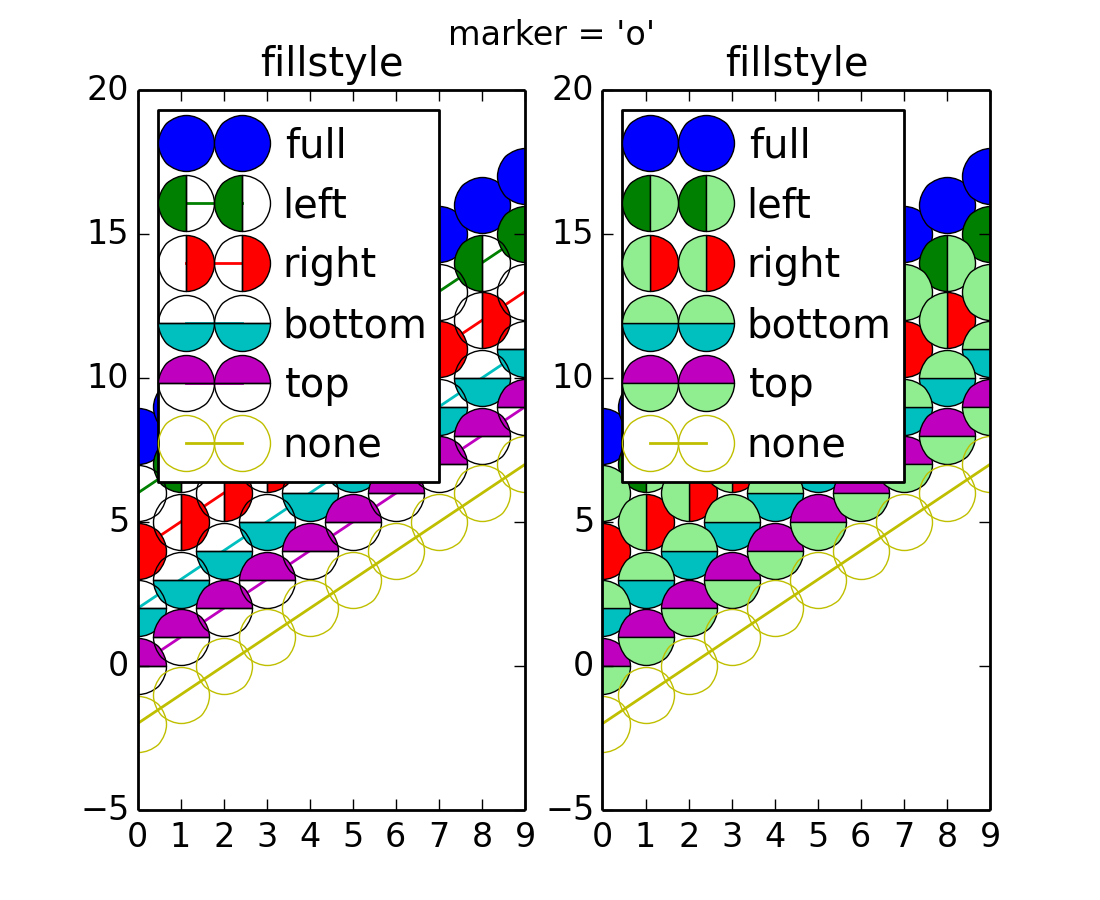
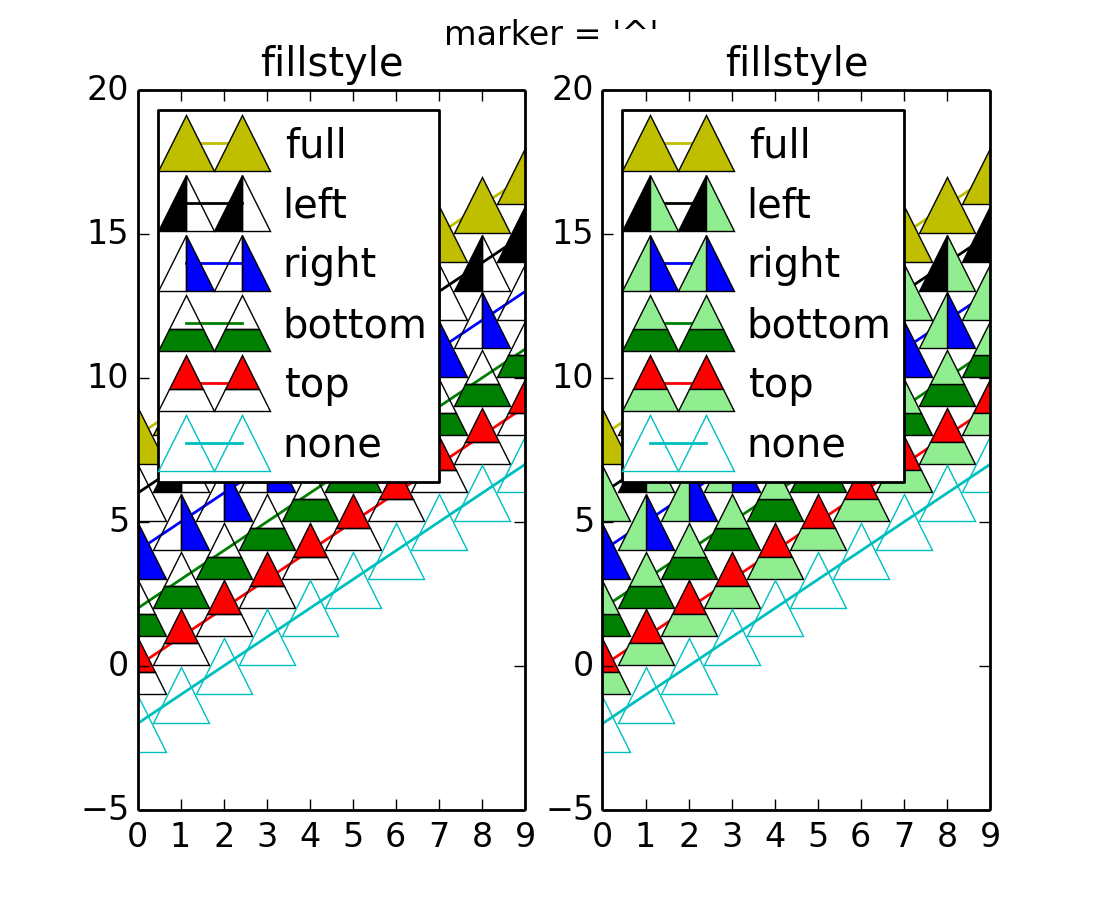
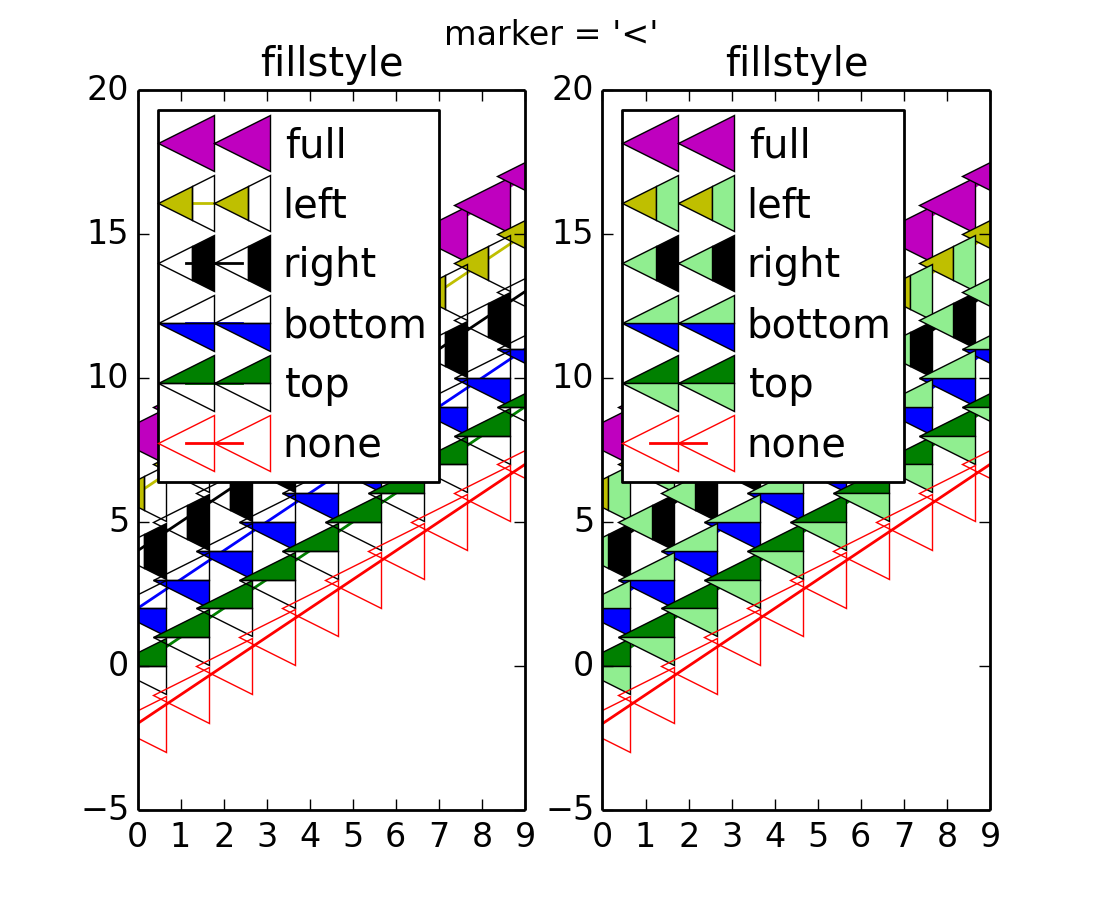
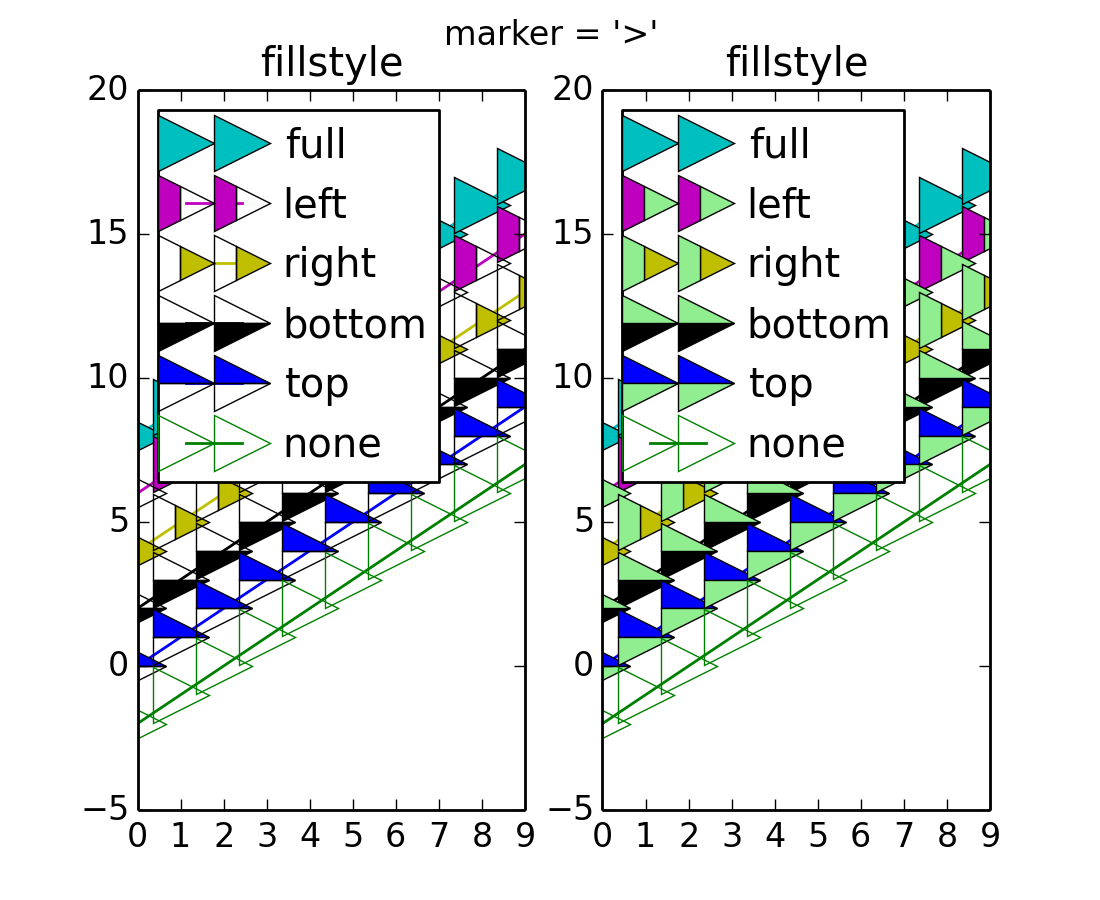
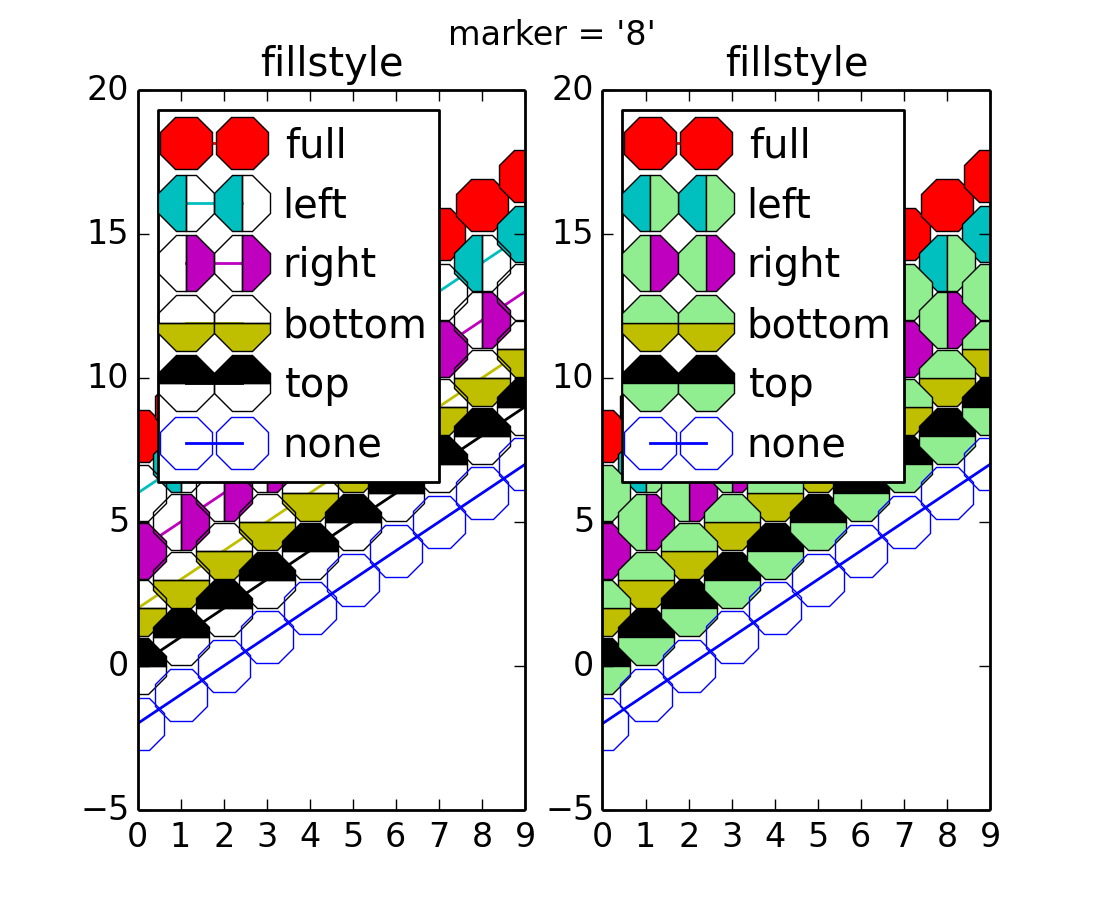
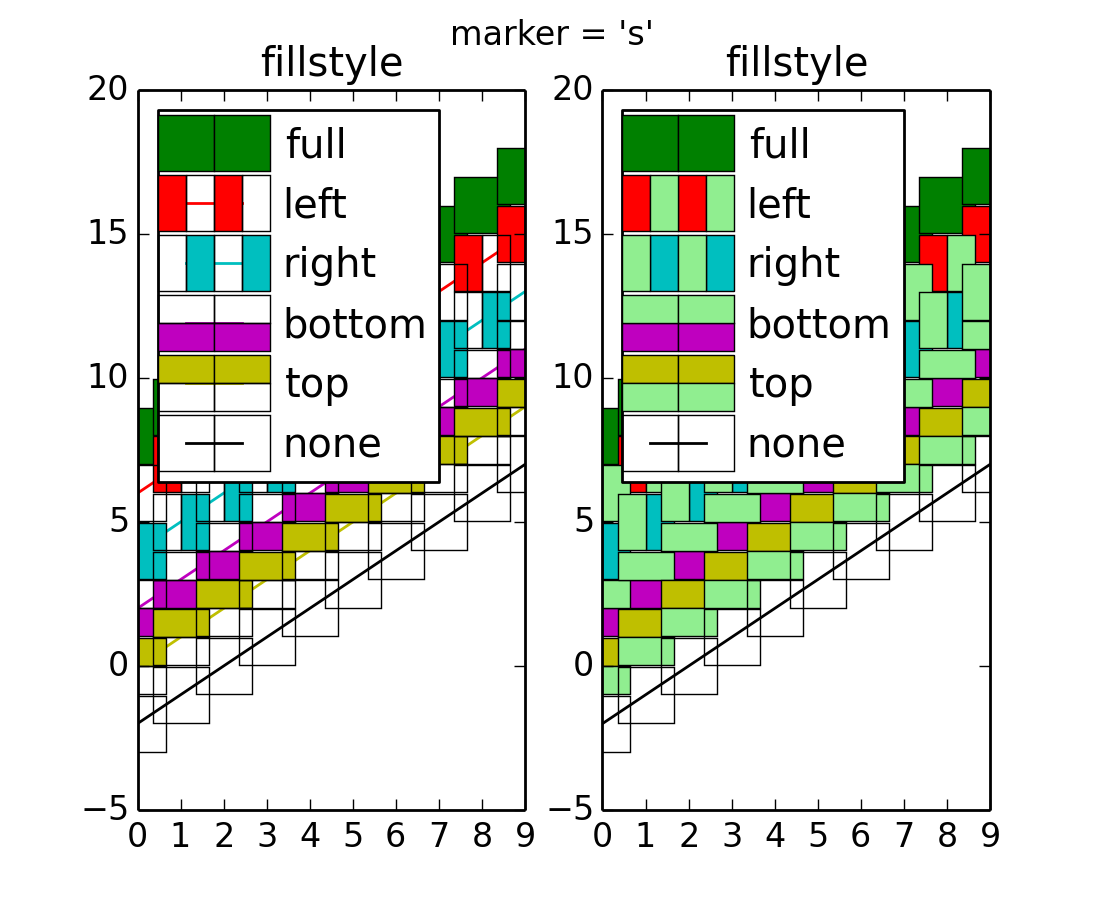
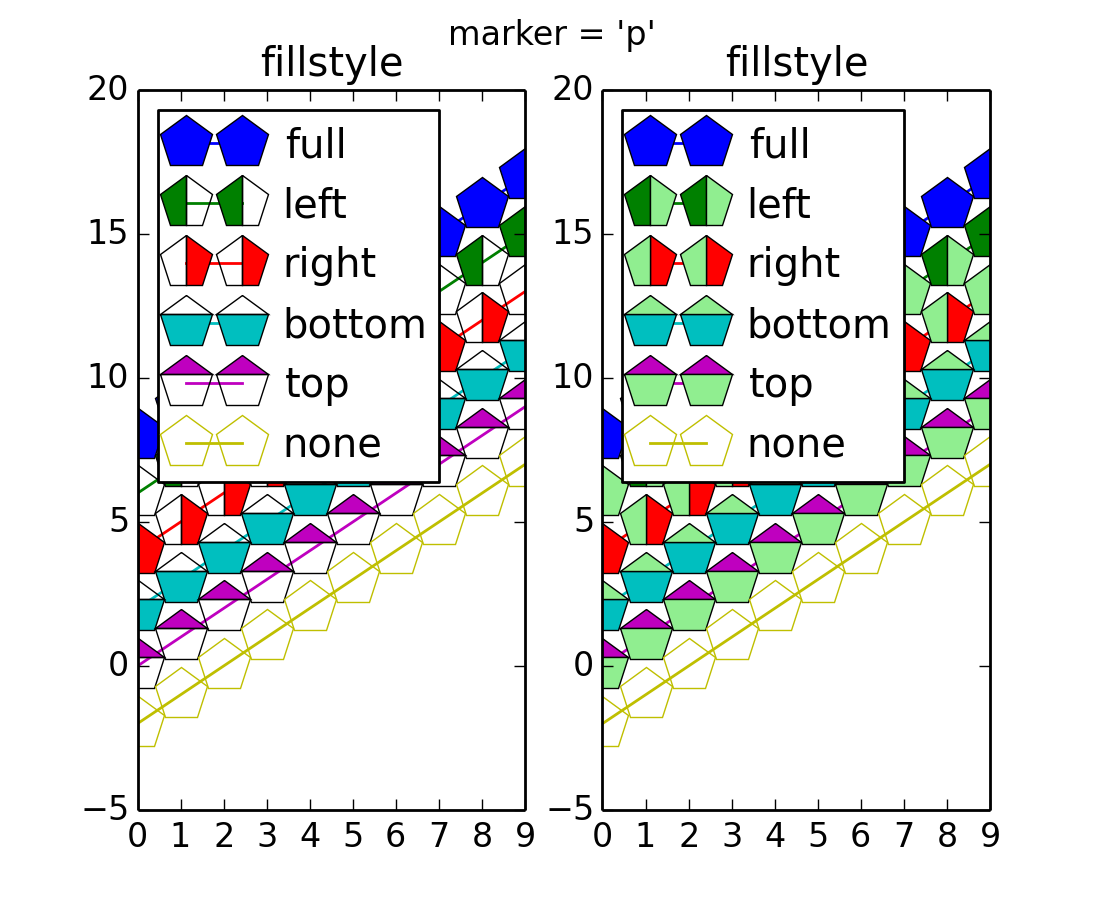
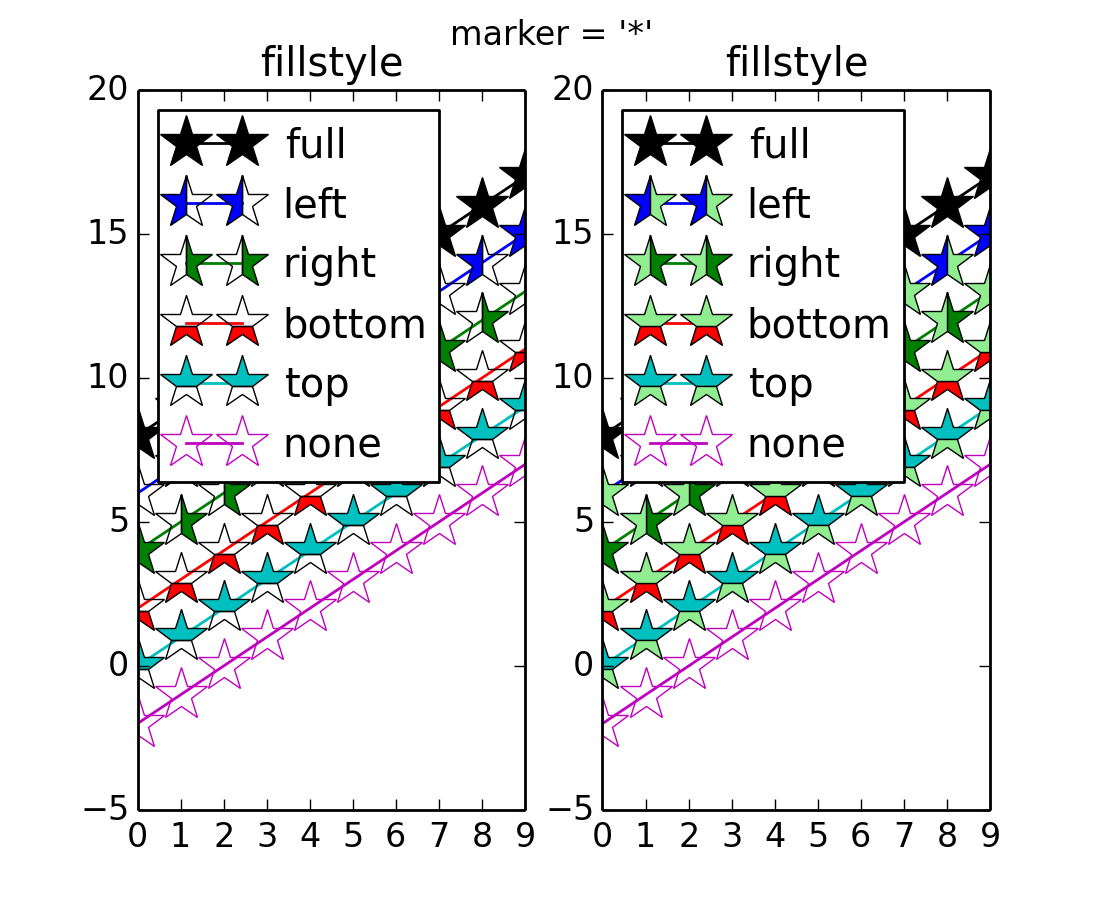
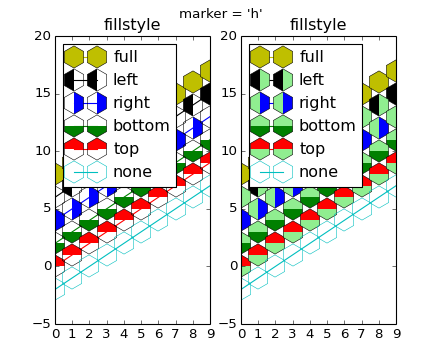
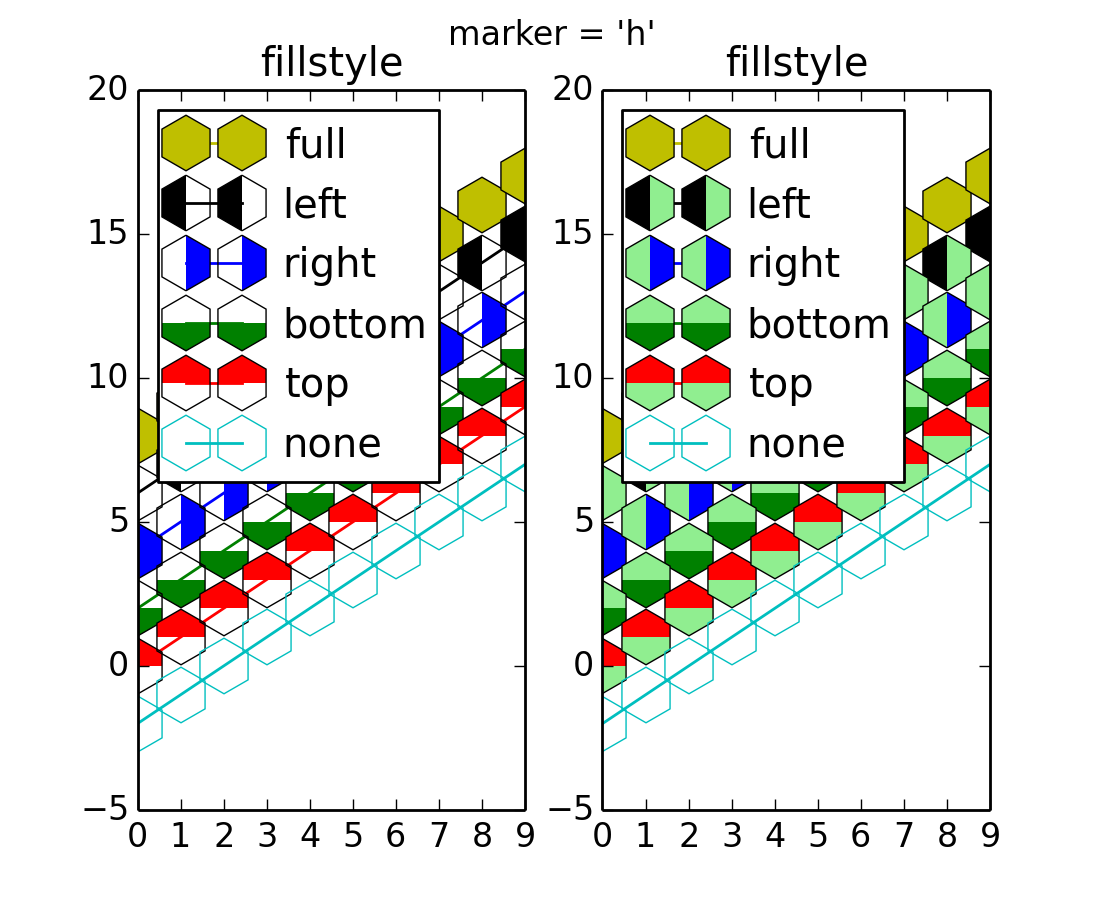
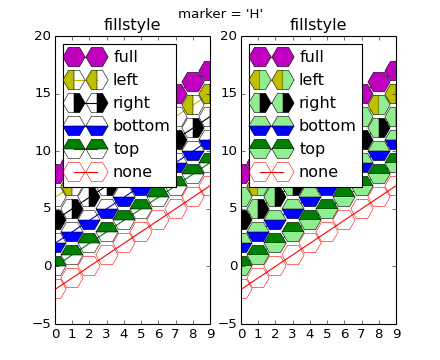
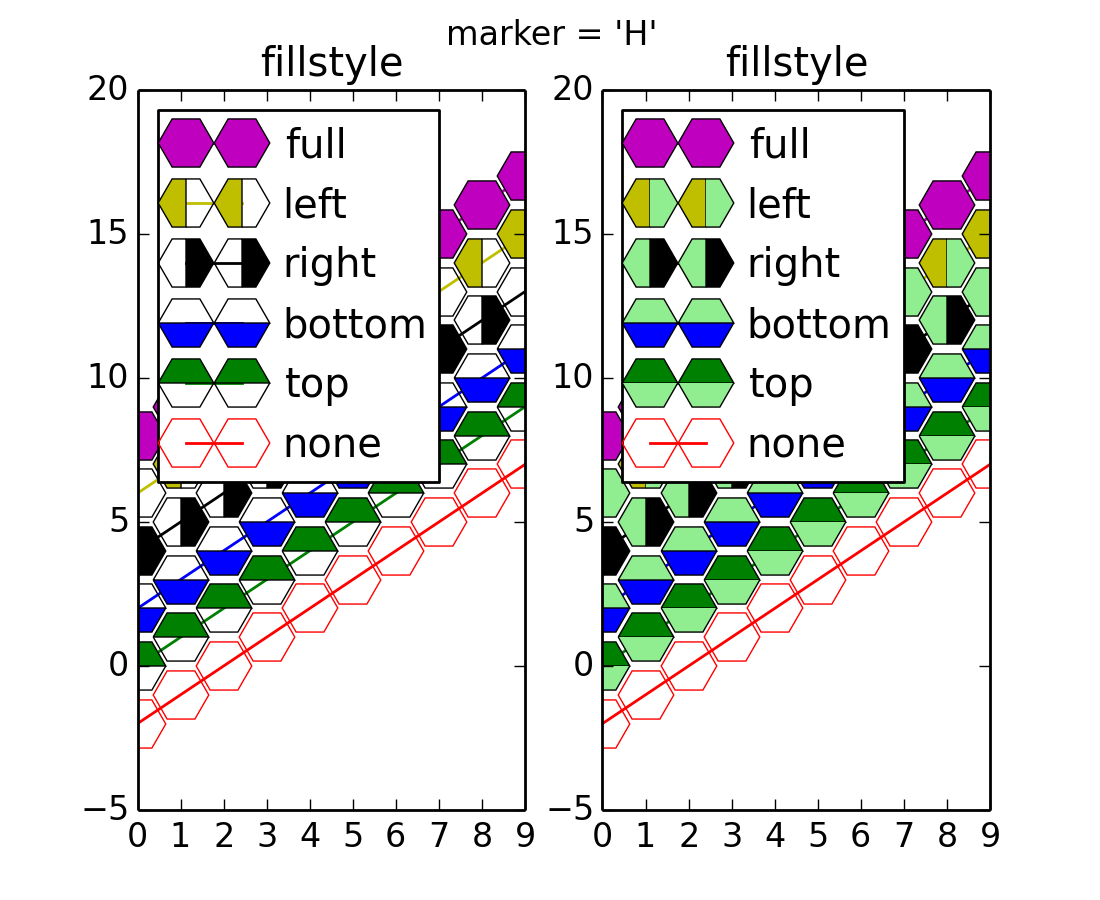
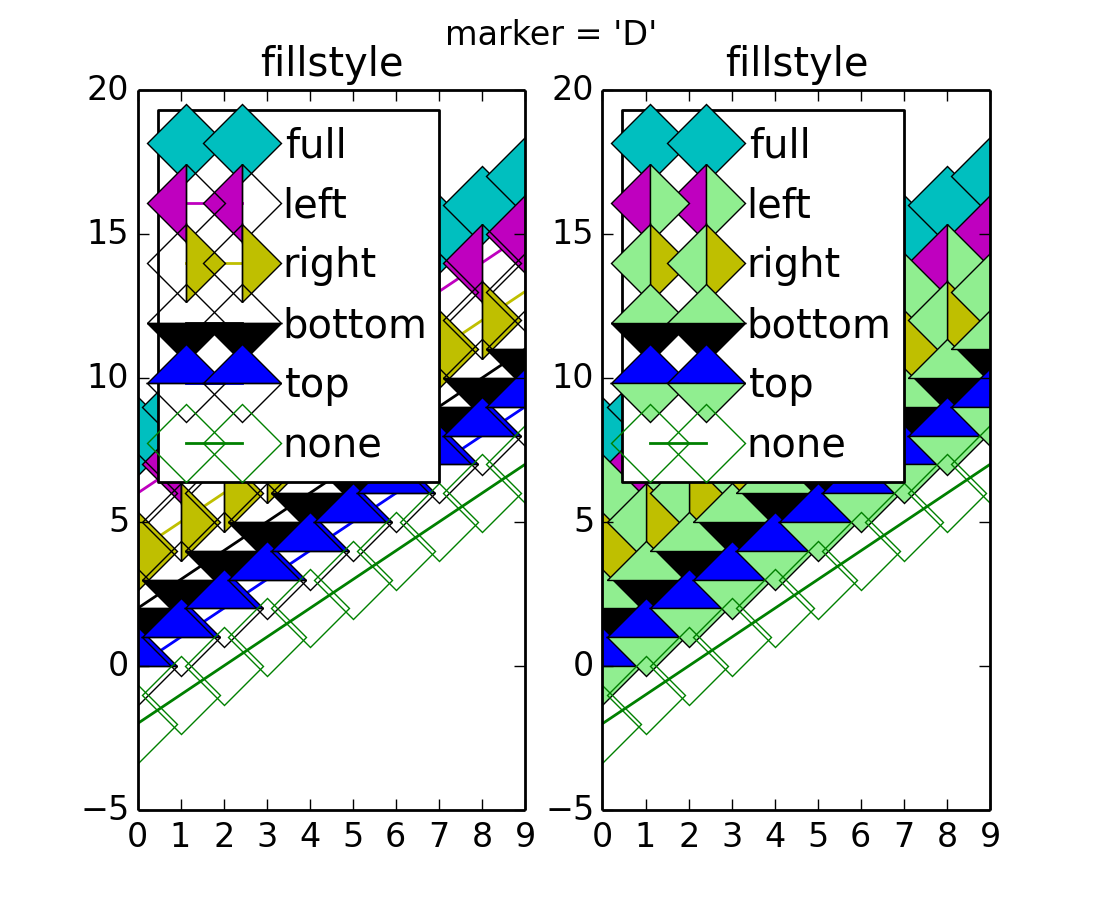
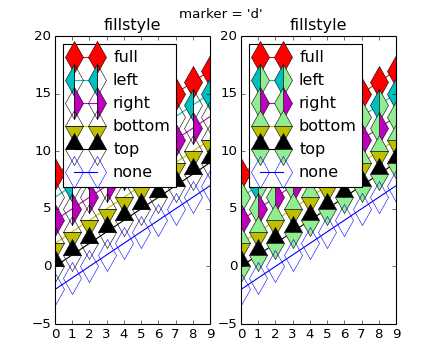
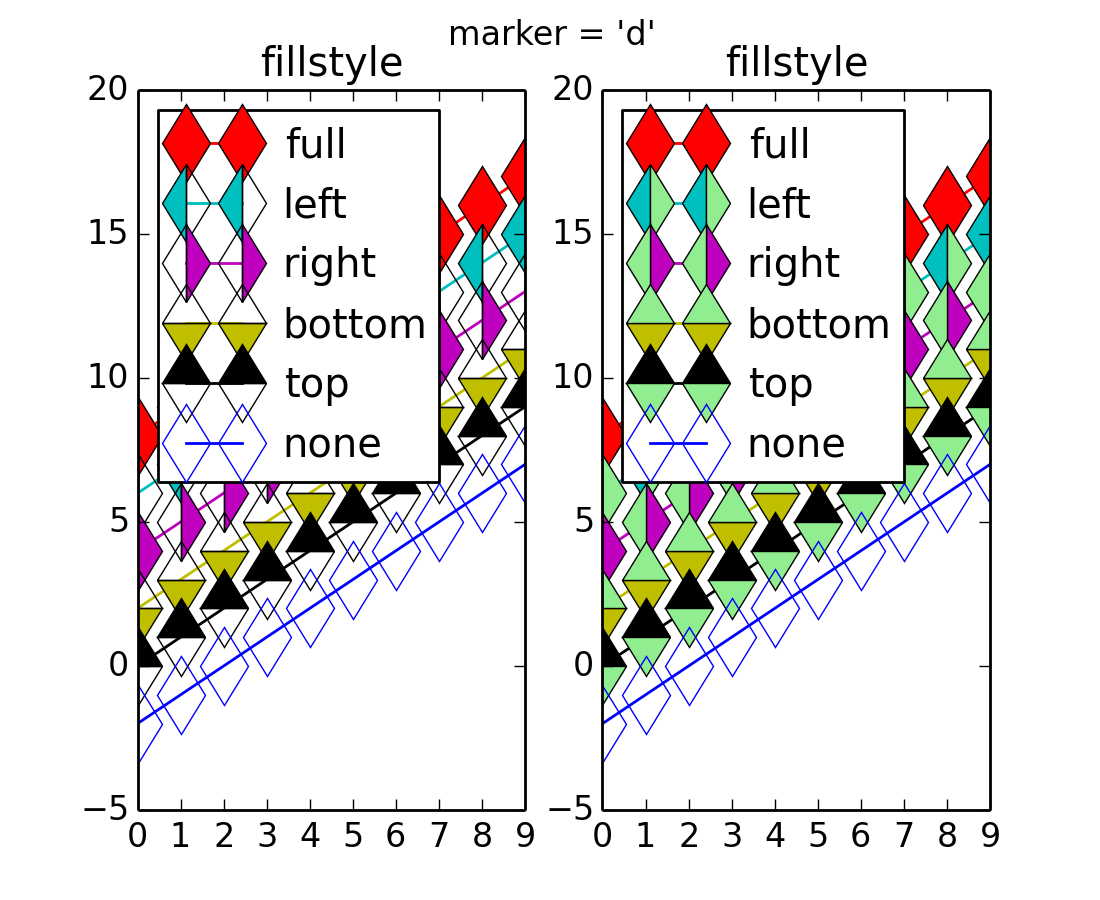
for marker in mlines.Line2D.filled_markers:
f = plt.figure()
f.text(.5,.95, "marker = %r" % marker, ha='center')
for i,fs in enumerate(mlines.Line2D.fillStyles):
color = colors.next()
ax = f.add_subplot(121)
ax.plot(2*(4-i)+y, c=color,
marker=marker,
markersize=20,
fillstyle=fs,
label=fs)
ax.legend(loc=2)
ax.set_title('fillstyle')
ax = f.add_subplot(122)
ax.plot(2*(4-i)+y, c=color,
marker=marker,
markersize=20,
markerfacecoloralt=altcolor,
fillstyle=fs,
label=fs)
ax.legend(loc=2)
ax.set_title('fillstyle')
plt.show()
Keywords: python, matplotlib, pylab, example, codex (see Search examples)


