
(Source code, png, hires.png, pdf)

"""
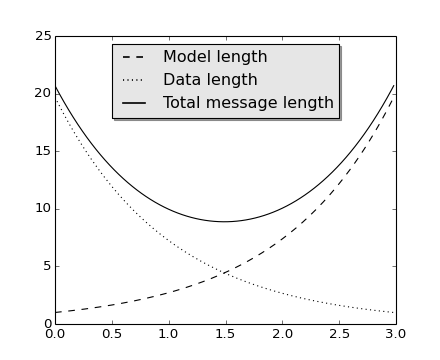
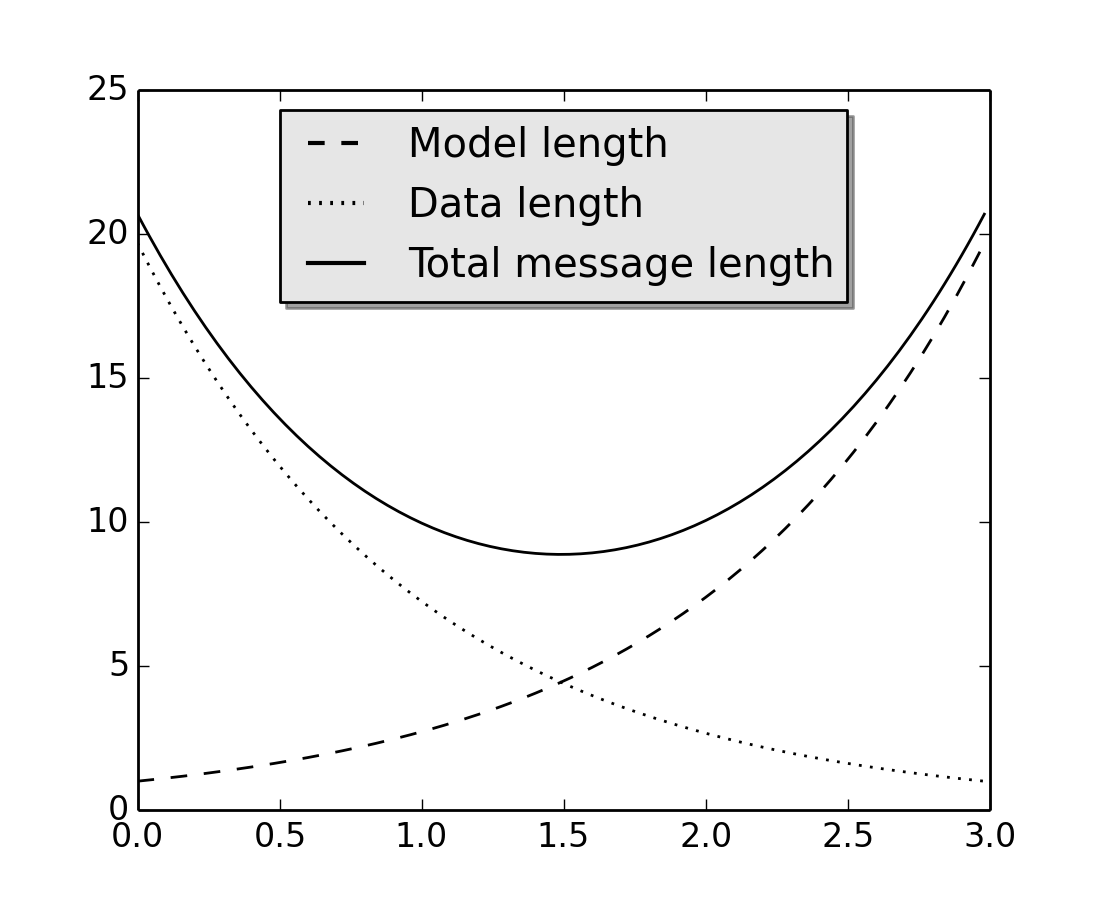
Demo of the legend function with a few features.
In addition to the basic legend, this demo shows a few optional features:
* Custom legend placement.
* A keyword argument to a drop-shadow.
* Setting the background color.
* Setting the font size.
* Setting the line width.
"""
import numpy as np
import matplotlib.pyplot as plt
# Example data
a = np.arange(0,3, .02)
b = np.arange(0,3, .02)
c = np.exp(a)
d = c[::-1]
# Create plots with pre-defined labels.
# Alternatively, you can pass labels explicitly when calling `legend`.
fig, ax = plt.subplots()
ax.plot(a, c, 'k--', label='Model length')
ax.plot(a, d, 'k:', label='Data length')
ax.plot(a, c+d, 'k', label='Total message length')
# Now add the legend with some customizations.
legend = ax.legend(loc='upper center', shadow=True)
# The frame is matplotlib.patches.Rectangle instance surrounding the legend.
frame = legend.get_frame()
frame.set_facecolor('0.90')
# Set the fontsize
for label in legend.get_texts():
label.set_fontsize('large')
for label in legend.get_lines():
label.set_linewidth(1.5) # the legend line width
plt.show()
Keywords: python, matplotlib, pylab, example, codex (see Search examples)