
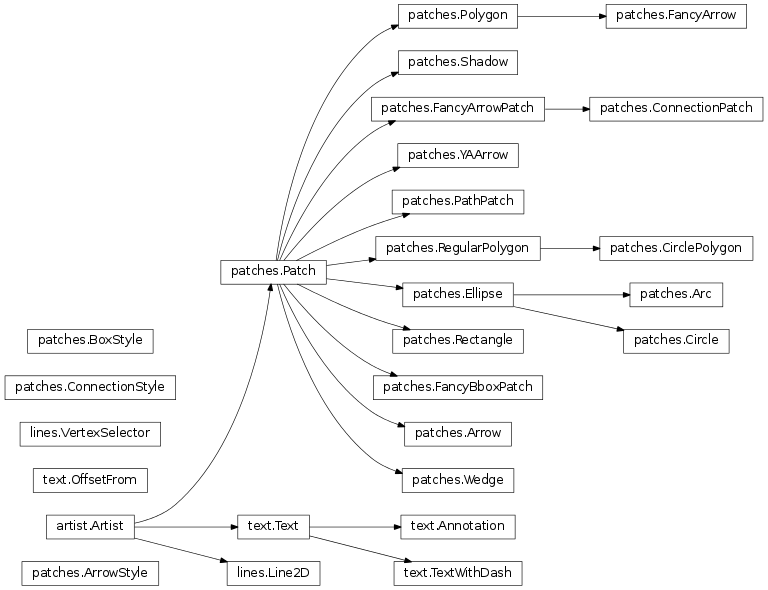
Bases: object
Abstract base class for someone who renders into a FigureCanvas.
Adds a callback function that will be called whenever one of the Artist‘s properties changes.
Returns an id that is useful for removing the callback with remove_callback() later.
Test whether the artist contains the mouse event.
Returns the truth value and a dictionary of artist specific details of selection, such as which points are contained in the pick radius. See individual artists for details.
For artists in an axes, if the xaxis has units support, convert x using xaxis unit type
For artists in an axes, if the yaxis has units support, convert y using yaxis unit type
Derived classes drawing method
Find artist objects.
Recursively find all Artist instances contained in self.
match can be
- None: return all objects contained in artist.
- function with signature boolean = match(artist) used to filter matches
- class instance: e.g., Line2D. Only return artists of class type.
If include_self is True (default), include self in the list to be checked for a match.
return filter function to be used for agg filter
Return the alpha value used for blending - not supported on all backends
Return the artist’s animated state
Return a list of the child Artist`s this :class:`Artist contains.
Return artist clipbox
Return whether artist uses clipping
Return artist clip path
Return the _contains test used by the artist, or None for default.
Returns the group id
Get the label used for this artist in the legend.
Return the picker object used by this artist
return True if the artist is to be rasterized
Returns the sketch parameters for the artist.
| Returns : | sketch_params : tuple or None A 3-tuple with the following elements: :
May return `None` if no sketch parameters were set. : |
|---|
Returns the snap setting which may be:
- True: snap vertices to the nearest pixel center
- False: leave vertices as-is
- None: (auto) If the path contains only rectilinear line segments, round to the nearest pixel center
Only supported by the Agg and MacOSX backends.
Return the clip path with the non-affine part of its transformation applied, and the remaining affine part of its transformation.
Returns the url
Return the artist’s visiblity
Get the axes bounding box in display space. Subclasses should override for inclusion in the bounding box “tight” calculation. Default is to return an empty bounding box at 0, 0.
Return True if units are set on the x or y axes
List the children of the artist which contain the mouse event event.
Fire an event when property changed, calling all of the registered callbacks.
call signature:
pick(mouseevent)
each child artist will fire a pick event if mouseevent is over the artist and the artist has picker set
return a dictionary mapping property name -> value for all Artist props
Remove the artist from the figure if possible. The effect will not be visible until the figure is redrawn, e.g., with matplotlib.axes.Axes.draw_idle(). Call matplotlib.axes.Axes.relim() to update the axes limits if desired.
Note: relim() will not see collections even if the collection was added to axes with autolim = True.
Note: there is no support for removing the artist’s legend entry.
Remove a callback based on its id.
See also
A tkstyle set command, pass kwargs to set properties
set agg_filter fuction.
Set the alpha value used for blending - not supported on all backends.
ACCEPTS: float (0.0 transparent through 1.0 opaque)
Set the artist’s animation state.
ACCEPTS: [True | False]
Set the Axes instance in which the artist resides, if any.
ACCEPTS: an Axes instance
Set the artist’s clip Bbox.
ACCEPTS: a matplotlib.transforms.Bbox instance
Set whether artist uses clipping.
ACCEPTS: [True | False]
Set the artist’s clip path, which may be:
For efficiency, if the path happens to be an axis-aligned rectangle, this method will set the clipping box to the corresponding rectangle and set the clipping path to None.
Replace the contains test used by this artist. The new picker should be a callable function which determines whether the artist is hit by the mouse event:
hit, props = picker(artist, mouseevent)
If the mouse event is over the artist, return hit = True and props is a dictionary of properties you want returned with the contains test.
ACCEPTS: a callable function
Set the Figure instance the artist belongs to.
ACCEPTS: a matplotlib.figure.Figure instance
Sets the (group) id for the artist
ACCEPTS: an id string
Set the label to s for auto legend.
ACCEPTS: string or anything printable with ‘%s’ conversion.
Set Level of Detail on or off. If on, the artists may examine things like the pixel width of the axes and draw a subset of their contents accordingly
ACCEPTS: [True | False]
set path_effects, which should be a list of instances of matplotlib.patheffect._Base class or its derivatives.
Set the epsilon for picking used by this artist
picker can be one of the following:
None: picking is disabled for this artist (default)
A boolean: if True then picking will be enabled and the artist will fire a pick event if the mouse event is over the artist
A float: if picker is a number it is interpreted as an epsilon tolerance in points and the artist will fire off an event if it’s data is within epsilon of the mouse event. For some artists like lines and patch collections, the artist may provide additional data to the pick event that is generated, e.g., the indices of the data within epsilon of the pick event
A function: if picker is callable, it is a user supplied function which determines whether the artist is hit by the mouse event:
hit, props = picker(artist, mouseevent)to determine the hit test. if the mouse event is over the artist, return hit=True and props is a dictionary of properties you want added to the PickEvent attributes.
ACCEPTS: [None|float|boolean|callable]
Force rasterized (bitmap) drawing in vector backend output.
Defaults to None, which implies the backend’s default behavior
ACCEPTS: [True | False | None]
Sets the the sketch parameters.
| Parameters : | scale : float, optional
length : float, optional
randomness : float, optional
|
|---|
Sets the snap setting which may be:
- True: snap vertices to the nearest pixel center
- False: leave vertices as-is
- None: (auto) If the path contains only rectilinear line segments, round to the nearest pixel center
Only supported by the Agg and MacOSX backends.
Sets the url for the artist
ACCEPTS: a url string
Set the artist’s visiblity.
ACCEPTS: [True | False]
Set the zorder for the artist. Artists with lower zorder values are drawn first.
ACCEPTS: any number
Copy properties from other to self.
A helper class to inspect an Artist and return information about it’s settable properties and their current values.
Initialize the artist inspector with an Artist or sequence of Artists. If a sequence is used, we assume it is a homogeneous sequence (all Artists are of the same type) and it is your responsibility to make sure this is so.
return ‘PROPNAME or alias’ if s has an alias, else return PROPNAME.
e.g., for the line markerfacecolor property, which has an alias, return ‘markerfacecolor or mfc’ and for the transform property, which does not, return ‘transform’
return ‘PROPNAME or alias’ if s has an alias, else return PROPNAME formatted for ReST
e.g., for the line markerfacecolor property, which has an alias, return ‘markerfacecolor or mfc’ and for the transform property, which does not, return ‘transform’
Recursively find all matplotlib.artist.Artist instances contained in self.
If match is not None, it can be
- function with signature boolean = match(artist)
- class instance: e.g., Line2D
used to filter matches.
Get a dict mapping fullname -> alias for each alias in the ArtistInspector.
e.g., for lines:
{'markerfacecolor': 'mfc',
 'linewidth'      : 'lw',
}
Get the attribute strings with setters for object. e.g., for a line, return ['markerfacecolor', 'linewidth', ....].
Get the legal arguments for the setter associated with attr.
This is done by querying the docstring of the function set_attr for a line that begins with ACCEPTS:
e.g., for a line linestyle, return “[ '-' | '--' | '-.' | ':' | 'steps' | 'None' ]”
Return True if method object o is an alias for another function.
Return the getters and actual values as list of strings.
If prop is None, return a list of strings of all settable properies and their valid values.
If prop is not None, it is a valid property name and that property will be returned as a string of property : valid values.
If prop is None, return a list of strings of all settable properies and their valid values. Format the output for ReST
If prop is not None, it is a valid property name and that property will be returned as a string of property : valid values.
return a dictionary mapping property name -> value
Decorator for Artist.draw method. Provides routines that run before and after the draw call. The before and after functions are useful for changing artist-dependant renderer attributes or making other setup function calls, such as starting and flushing a mixed-mode renderer.
Return the value of object’s property. property is an optional string for the property you want to return
Example usage:
getp(obj)  # get all the object properties
getp(obj, 'linestyle')  # get the linestyle property
obj is a Artist instance, e.g., Line2D or an instance of a Axes or matplotlib.text.Text. If the property is ‘somename’, this function returns
obj.get_somename()
getp() can be used to query all the gettable properties with getp(obj). Many properties have aliases for shorter typing, e.g. ‘lw’ is an alias for ‘linewidth’. In the output, aliases and full property names will be listed as:
property or alias = value
e.g.:
linewidth or lw = 2
Set a property on an artist object.
matplotlib supports the use of setp() (“set property”) and getp() to set and get object properties, as well as to do introspection on the object. For example, to set the linestyle of a line to be dashed, you can do:
>>> line, = plot([1,2,3])
>>> setp(line, linestyle='--')
If you want to know the valid types of arguments, you can provide the name of the property you want to set without a value:
>>> setp(line, 'linestyle')
    linestyle: [ '-' | '--' | '-.' | ':' | 'steps' | 'None' ]
If you want to see all the properties that can be set, and their possible values, you can do:
>>> setp(line)
    ... long output listing omitted
setp() operates on a single instance or a list of instances. If you are in query mode introspecting the possible values, only the first instance in the sequence is used. When actually setting values, all the instances will be set. e.g., suppose you have a list of two lines, the following will make both lines thicker and red:
>>> x = arange(0,1.0,0.01)
>>> y1 = sin(2*pi*x)
>>> y2 = sin(4*pi*x)
>>> lines = plot(x, y1, x, y2)
>>> setp(lines, linewidth=2, color='r')
setp() works with the MATLAB style string/value pairs or with python kwargs. For example, the following are equivalent:
>>> setp(lines, 'linewidth', 2, 'color', 'r')  # MATLAB style
>>> setp(lines, linewidth=2, color='r')        # python style
This module contains all the 2D line class which can draw with a variety of line styles, markers and colors.
Bases: matplotlib.artist.Artist
A line - the line can have both a solid linestyle connecting all the vertices, and a marker at each vertex. Additionally, the drawing of the solid line is influenced by the drawstyle, eg one can create “stepped” lines in various styles.
Create a Line2D instance with x and y data in sequences xdata, ydata.
The kwargs are Line2D properties:
Property Description agg_filter unknown alpha float (0.0 transparent through 1.0 opaque) animated [True | False] antialiased or aa [True | False] axes an Axes instance clip_box a matplotlib.transforms.Bbox instance clip_on [True | False] clip_path [ (Path, Transform) | Patch | None ] color or c any matplotlib color contains a callable function dash_capstyle [‘butt’ | ‘round’ | ‘projecting’] dash_joinstyle [‘miter’ | ‘round’ | ‘bevel’] dashes sequence of on/off ink in points data 2D array (rows are x, y) or two 1D arrays drawstyle [‘default’ | ‘steps’ | ‘steps-pre’ | ‘steps-mid’ | ‘steps-post’] figure a matplotlib.figure.Figure instance fillstyle [‘full’ | ‘left’ | ‘right’ | ‘bottom’ | ‘top’ | ‘none’] gid an id string label string or anything printable with ‘%s’ conversion. linestyle or ls ['-' | '--' | '-.' | ':' | 'None' | ' ' | ''] and any drawstyle in combination with a linestyle, e.g., 'steps--'. linewidth or lw float value in points lod [True | False] marker unknown markeredgecolor or mec any matplotlib color markeredgewidth or mew float value in points markerfacecolor or mfc any matplotlib color markerfacecoloralt or mfcalt any matplotlib color markersize or ms float markevery None | integer | (startind, stride) path_effects unknown picker float distance in points or callable pick function fn(artist, event) pickradius float distance in points rasterized [True | False | None] sketch_params unknown snap unknown solid_capstyle [‘butt’ | ‘round’ | ‘projecting’] solid_joinstyle [‘miter’ | ‘round’ | ‘bevel’] transform a matplotlib.transforms.Transform instance url a url string visible [True | False] xdata 1D array ydata 1D array zorder any number
See set_linestyle() for a decription of the line styles, set_marker() for a description of the markers, and set_drawstyle() for a description of the draw styles.
Test whether the mouse event occurred on the line. The pick radius determines the precision of the location test (usually within five points of the value). Use get_pickradius() or set_pickradius() to view or modify it.
Returns True if any values are within the radius along with {'ind': pointlist}, where pointlist is the set of points within the radius.
TODO: sort returned indices by distance
draw the Line with renderer unless visiblity is False
alias for get_antialiased
alias for get_color
Get the cap style for dashed linestyles
Get the join style for dashed linestyles
Return the xdata, ydata.
If orig is True, return the original data.
return the marker fillstyle
alias for get_linestyle
alias for get_linewidth
return the markevery setting
alias for get_markeredgecolor
alias for get_markeredgewidth
alias for get_markerfacecolor
alias for get_markerfacecoloralt
alias for get_markersize
return the pick radius used for containment tests
Get the cap style for solid linestyles
Get the join style for solid linestyles
Return the xdata.
If orig is True, return the original data, else the processed data.
Return the xy data as a Nx2 numpy array.
Return the ydata.
If orig is True, return the original data, else the processed data.
return True if line is dashstyle
alias for set_antialiased
True if line should be drawin with antialiased rendering
ACCEPTS: [True | False]
alias for set_color
Set the color of the line
ACCEPTS: any matplotlib color
Set the cap style for dashed linestyles
ACCEPTS: [‘butt’ | ‘round’ | ‘projecting’]
Set the join style for dashed linestyles ACCEPTS: [‘miter’ | ‘round’ | ‘bevel’]
Set the dash sequence, sequence of dashes with on off ink in points. If seq is empty or if seq = (None, None), the linestyle will be set to solid.
ACCEPTS: sequence of on/off ink in points
Set the x and y data
ACCEPTS: 2D array (rows are x, y) or two 1D arrays
Set the drawstyle of the plot
‘default’ connects the points with lines. The steps variants produce step-plots. ‘steps’ is equivalent to ‘steps-pre’ and is maintained for backward-compatibility.
Set the marker fill style; ‘full’ means fill the whole marker. ‘none’ means no filling; other options are for half-filled markers.
ACCEPTS: [‘full’ | ‘left’ | ‘right’ | ‘bottom’ | ‘top’ | ‘none’]
Set the linestyle of the line (also accepts drawstyles)
| linestyle | description |
|---|---|
| '-' | solid |
| '--' | dashed |
| '-.' | dash_dot |
| ':' | dotted |
| 'None' | draw nothing |
| ' ' | draw nothing |
| '' | draw nothing |
‘steps’ is equivalent to ‘steps-pre’ and is maintained for backward-compatibility.
See also
and any drawstyle in combination with a linestyle, e.g., 'steps--'.
Set the line width in points
ACCEPTS: float value in points
alias for set_linestyle
alias for set_linewidth
Set the line marker
| Parameters : | marker: marker style :
|
|---|
Set the marker edge color
ACCEPTS: any matplotlib color
Set the marker edge width in points
ACCEPTS: float value in points
Set the marker face color.
ACCEPTS: any matplotlib color
Set the alternate marker face color.
ACCEPTS: any matplotlib color
Set the marker size in points
ACCEPTS: float
Set the markevery property to subsample the plot when using markers. e.g., if markevery=5, every 5-th marker will be plotted. every can be
ACCEPTS: None | integer | (startind, stride)
alias for set_markeredgecolor
alias for set_markeredgewidth
alias for set_markerfacecolor
alias for set_markerfacecoloralt
alias for set_markersize
Sets the event picker details for the line.
ACCEPTS: float distance in points or callable pick function fn(artist, event)
Sets the pick radius used for containment tests
ACCEPTS: float distance in points
Set the cap style for solid linestyles
ACCEPTS: [‘butt’ | ‘round’ | ‘projecting’]
Set the join style for solid linestyles ACCEPTS: [‘miter’ | ‘round’ | ‘bevel’]
set the Transformation instance used by this artist
ACCEPTS: a matplotlib.transforms.Transform instance
Set the data np.array for x
ACCEPTS: 1D array
Set the data np.array for y
ACCEPTS: 1D array
copy properties from other to self
Manage the callbacks to maintain a list of selected vertices for matplotlib.lines.Line2D. Derived classes should override process_selected() to do something with the picks.
Here is an example which highlights the selected verts with red circles:
import numpy as np
import matplotlib.pyplot as plt
import matplotlib.lines as lines

class HighlightSelected(lines.VertexSelector):
    def __init__(self, line, fmt='ro', **kwargs):
        lines.VertexSelector.__init__(self, line)
        self.markers, = self.axes.plot([], [], fmt, **kwargs)

    def process_selected(self, ind, xs, ys):
        self.markers.set_data(xs, ys)
        self.canvas.draw()

fig = plt.figure()
ax = fig.add_subplot(111)
x, y = np.random.rand(2, 30)
line, = ax.plot(x, y, 'bs-', picker=5)

selector = HighlightSelected(line)
plt.show()
Initialize the class with a matplotlib.lines.Line2D instance. The line should already be added to some matplotlib.axes.Axes instance and should have the picker property set.
When the line is picked, update the set of selected indicies.
Default “do nothing” implementation of the process_selected() method.
ind are the indices of the selected vertices. xs and ys are the coordinates of the selected vertices.
Determine if any line segments are within radius of a point. Returns the list of line segments that are within that radius.
Bases: matplotlib.patches.Ellipse
An elliptical arc. Because it performs various optimizations, it can not be filled.
The arc must be used in an Axes instance—it can not be added directly to a Figure—because it is optimized to only render the segments that are inside the axes bounding box with high resolution.
The following args are supported:
If theta1 and theta2 are not provided, the arc will form a complete ellipse.
Valid kwargs are:
Property Description agg_filter unknown alpha float or None animated [True | False] antialiased or aa [True | False] or None for default axes an Axes instance clip_box a matplotlib.transforms.Bbox instance clip_on [True | False] clip_path [ (Path, Transform) | Patch | None ] color matplotlib color spec contains a callable function edgecolor or ec mpl color spec, or None for default, or ‘none’ for no color facecolor or fc mpl color spec, or None for default, or ‘none’ for no color figure a matplotlib.figure.Figure instance fill [True | False] gid an id string hatch [‘/’ | ‘\’ | ‘|’ | ‘-‘ | ‘+’ | ‘x’ | ‘o’ | ‘O’ | ‘.’ | ‘*’] label string or anything printable with ‘%s’ conversion. linestyle or ls [‘solid’ | ‘dashed’ | ‘dashdot’ | ‘dotted’] linewidth or lw float or None for default lod [True | False] path_effects unknown picker [None|float|boolean|callable] rasterized [True | False | None] sketch_params unknown snap unknown transform Transform instance url a url string visible [True | False] zorder any number
Ellipses are normally drawn using an approximation that uses eight cubic bezier splines. The error of this approximation is 1.89818e-6, according to this unverified source:
Lancaster, Don. Approximating a Circle or an Ellipse Using Four Bezier Cubic Splines.
There is a use case where very large ellipses must be drawn with very high accuracy, and it is too expensive to render the entire ellipse with enough segments (either splines or line segments). Therefore, in the case where either radius of the ellipse is large enough that the error of the spline approximation will be visible (greater than one pixel offset from the ideal), a different technique is used.
In that case, only the visible parts of the ellipse are drawn, with each visible arc using a fixed number of spline segments (8). The algorithm proceeds as follows:
The points where the ellipse intersects the axes bounding box are located. (This is done be performing an inverse transformation on the axes bbox such that it is relative to the unit circle – this makes the intersection calculation much easier than doing rotated ellipse intersection directly).
This uses the “line intersecting a circle” algorithm from:
Vince, John. Geometry for Computer Graphics: Formulae, Examples & Proofs. London: Springer-Verlag, 2005.
The angles of each of the intersection points are calculated.
Proceeding counterclockwise starting in the positive x-direction, each of the visible arc-segments between the pairs of vertices are drawn using the bezier arc approximation technique implemented in matplotlib.path.Path.arc().
Bases: matplotlib.patches.Patch
An arrow patch.
Draws an arrow, starting at (x, y), direction and length given by (dx, dy) the width of the arrow is scaled by width.
Valid kwargs are:
Property Description agg_filter unknown alpha float or None animated [True | False] antialiased or aa [True | False] or None for default axes an Axes instance clip_box a matplotlib.transforms.Bbox instance clip_on [True | False] clip_path [ (Path, Transform) | Patch | None ] color matplotlib color spec contains a callable function edgecolor or ec mpl color spec, or None for default, or ‘none’ for no color facecolor or fc mpl color spec, or None for default, or ‘none’ for no color figure a matplotlib.figure.Figure instance fill [True | False] gid an id string hatch [‘/’ | ‘\’ | ‘|’ | ‘-‘ | ‘+’ | ‘x’ | ‘o’ | ‘O’ | ‘.’ | ‘*’] label string or anything printable with ‘%s’ conversion. linestyle or ls [‘solid’ | ‘dashed’ | ‘dashdot’ | ‘dotted’] linewidth or lw float or None for default lod [True | False] path_effects unknown picker [None|float|boolean|callable] rasterized [True | False | None] sketch_params unknown snap unknown transform Transform instance url a url string visible [True | False] zorder any number
Bases: matplotlib.patches._Style
ArrowStyle is a container class which defines several arrowstyle classes, which is used to create an arrow path along a given path. These are mainly used with FancyArrowPatch.
A arrowstyle object can be either created as:
ArrowStyle.Fancy(head_length=.4, head_width=.4, tail_width=.4)
or:
ArrowStyle("Fancy", head_length=.4, head_width=.4, tail_width=.4)
or:
ArrowStyle("Fancy, head_length=.4, head_width=.4, tail_width=.4")
The following classes are defined
Class Name Attrs Curve - None CurveB -> head_length=0.4,head_width=0.2 BracketB -[ widthB=1.0,lengthB=0.2,angleB=None CurveFilledB -|> head_length=0.4,head_width=0.2 CurveA <- head_length=0.4,head_width=0.2 CurveAB <-> head_length=0.4,head_width=0.2 CurveFilledA <|- head_length=0.4,head_width=0.2 CurveFilledAB <|-|> head_length=0.4,head_width=0.2 BracketA ]- widthA=1.0,lengthA=0.2,angleA=None BracketAB ]-[ widthA=1.0,lengthA=0.2,angleA=None,widthB=1.0,lengthB=0.2,angleB=None Fancy fancy head_length=0.4,head_width=0.4,tail_width=0.4 Simple simple head_length=0.5,head_width=0.5,tail_width=0.2 Wedge wedge tail_width=0.3,shrink_factor=0.5 BarAB |-| widthA=1.0,angleA=None,widthB=1.0,angleB=None
An instance of any arrow style class is an callable object, whose call signature is:
__call__(self, path, mutation_size, linewidth, aspect_ratio=1.)
and it returns a tuple of a Path instance and a boolean value. path is a Path instance along witch the arrow will be drawn. mutation_size and aspect_ratio has a same meaning as in BoxStyle. linewidth is a line width to be stroked. This is meant to be used to correct the location of the head so that it does not overshoot the destination point, but not all classes support it.
(Source code, png, hires.png, pdf)

Bases: matplotlib.patches._Bracket
An arrow with a bar(|) at both ends.
Bases: matplotlib.patches._Bracket
An arrow with a bracket(]) at its end.
Bases: matplotlib.patches._Bracket
An arrow with a bracket(]) at both ends.
Bases: matplotlib.patches._Bracket
An arrow with a bracket([) at its end.
Bases: matplotlib.patches._Curve
A simple curve without any arrow head.
Bases: matplotlib.patches._Curve
An arrow with a head at its begin point.
Bases: matplotlib.patches._Curve
An arrow with heads both at the begin and the end point.
Bases: matplotlib.patches._Curve
An arrow with a head at its end point.
Bases: matplotlib.patches._Curve
An arrow with filled triangle head at the begin.
Bases: matplotlib.patches._Curve
An arrow with filled triangle heads both at the begin and the end point.
Bases: matplotlib.patches._Curve
An arrow with filled triangle head at the end.
Bases: matplotlib.patches._Base
A fancy arrow. Only works with a quadratic bezier curve.
Bases: matplotlib.patches._Base
A simple arrow. Only works with a quadratic bezier curve.
Bases: matplotlib.patches._Base
Wedge(?) shape. Only wokrs with a quadratic bezier curve. The begin point has a width of the tail_width and the end point has a width of 0. At the middle, the width is shrink_factor*tail_width.
Bases: matplotlib.patches._Style
BoxStyle is a container class which defines several boxstyle classes, which are used for FancyBoxPatch.
A style object can be created as:
BoxStyle.Round(pad=0.2)
or:
BoxStyle("Round", pad=0.2)
or:
BoxStyle("Round, pad=0.2")
Following boxstyle classes are defined.
Class Name Attrs LArrow larrow pad=0.3 RArrow rarrow pad=0.3 Round round pad=0.3,rounding_size=None Round4 round4 pad=0.3,rounding_size=None Roundtooth roundtooth pad=0.3,tooth_size=None Sawtooth sawtooth pad=0.3,tooth_size=None Square square pad=0.3
An instance of any boxstyle class is an callable object, whose call signature is:
__call__(self, x0, y0, width, height, mutation_size, aspect_ratio=1.)
and returns a Path instance. x0, y0, width and height specify the location and size of the box to be drawn. mutation_scale determines the overall size of the mutation (by which I mean the transformation of the rectangle to the fancy box). mutation_aspect determines the aspect-ratio of the mutation.
(Source code, png, hires.png, pdf)

Bases: matplotlib.patches._Base
(left) Arrow Box
Bases: matplotlib.patches.LArrow
(right) Arrow Box
Bases: matplotlib.patches._Base
A box with round corners.
Bases: matplotlib.patches._Base
Another box with round edges.
Bases: matplotlib.patches.Sawtooth
A roundtooth(?) box.
Bases: matplotlib.patches.Ellipse
A circle patch.
Create true circle at center xy = (x, y) with given radius. Unlike CirclePolygon which is a polygonal approximation, this uses Bézier splines and is much closer to a scale-free circle.
Valid kwargs are:
Property Description agg_filter unknown alpha float or None animated [True | False] antialiased or aa [True | False] or None for default axes an Axes instance clip_box a matplotlib.transforms.Bbox instance clip_on [True | False] clip_path [ (Path, Transform) | Patch | None ] color matplotlib color spec contains a callable function edgecolor or ec mpl color spec, or None for default, or ‘none’ for no color facecolor or fc mpl color spec, or None for default, or ‘none’ for no color figure a matplotlib.figure.Figure instance fill [True | False] gid an id string hatch [‘/’ | ‘\’ | ‘|’ | ‘-‘ | ‘+’ | ‘x’ | ‘o’ | ‘O’ | ‘.’ | ‘*’] label string or anything printable with ‘%s’ conversion. linestyle or ls [‘solid’ | ‘dashed’ | ‘dashdot’ | ‘dotted’] linewidth or lw float or None for default lod [True | False] path_effects unknown picker [None|float|boolean|callable] rasterized [True | False | None] sketch_params unknown snap unknown transform Transform instance url a url string visible [True | False] zorder any number
return the radius of the circle
return the radius of the circle
Set the radius of the circle
ACCEPTS: float
Bases: matplotlib.patches.RegularPolygon
A polygon-approximation of a circle patch.
Create a circle at xy = (x, y) with given radius. This circle is approximated by a regular polygon with resolution sides. For a smoother circle drawn with splines, see Circle.
Valid kwargs are:
Property Description agg_filter unknown alpha float or None animated [True | False] antialiased or aa [True | False] or None for default axes an Axes instance clip_box a matplotlib.transforms.Bbox instance clip_on [True | False] clip_path [ (Path, Transform) | Patch | None ] color matplotlib color spec contains a callable function edgecolor or ec mpl color spec, or None for default, or ‘none’ for no color facecolor or fc mpl color spec, or None for default, or ‘none’ for no color figure a matplotlib.figure.Figure instance fill [True | False] gid an id string hatch [‘/’ | ‘\’ | ‘|’ | ‘-‘ | ‘+’ | ‘x’ | ‘o’ | ‘O’ | ‘.’ | ‘*’] label string or anything printable with ‘%s’ conversion. linestyle or ls [‘solid’ | ‘dashed’ | ‘dashdot’ | ‘dotted’] linewidth or lw float or None for default lod [True | False] path_effects unknown picker [None|float|boolean|callable] rasterized [True | False | None] sketch_params unknown snap unknown transform Transform instance url a url string visible [True | False] zorder any number
Bases: matplotlib.patches.FancyArrowPatch
A ConnectionPatch class is to make connecting lines between two points (possibly in different axes).
Connect point xyA in coordsA with point xyB in coordsB
Valid keys are
| Key | Description |
|---|---|
| arrowstyle | the arrow style |
| connectionstyle | the connection style |
| relpos | default is (0.5, 0.5) |
| patchA | default is bounding box of the text |
| patchB | default is None |
| shrinkA | default is 2 points |
| shrinkB | default is 2 points |
| mutation_scale | default is text size (in points) |
| mutation_aspect | default is 1. |
| ? | any key for matplotlib.patches.PathPatch |
coordsA and coordsB are strings that indicate the coordinates of xyA and xyB.
| Property | Description |
|---|---|
| ‘figure points’ | points from the lower left corner of the figure |
| ‘figure pixels’ | pixels from the lower left corner of the figure |
| ‘figure fraction’ | 0,0 is lower left of figure and 1,1 is upper, right |
| ‘axes points’ | points from lower left corner of axes |
| ‘axes pixels’ | pixels from lower left corner of axes |
| ‘axes fraction’ | 0,1 is lower left of axes and 1,1 is upper right |
| ‘data’ | use the coordinate system of the object being annotated (default) |
| ‘offset points’ | Specify an offset (in points) from the xy value |
| ‘polar’ | you can specify theta, r for the annotation, even in cartesian plots. Note that if you are using a polar axes, you do not need to specify polar for the coordinate system since that is the native “data” coordinate system. |
Draw.
Return annotation_clip attribute. See set_annotation_clip() for the meaning of return values.
Return the mutated path of the arrow in the display coord
set annotation_clip attribute.
- True: the annotation will only be drawn when self.xy is inside the
axes.
- False: the annotation will always be drawn regardless of its
position.
None: the self.xy will be checked only if xycoords is “data”
Bases: matplotlib.patches._Style
ConnectionStyle is a container class which defines several connectionstyle classes, which is used to create a path between two points. These are mainly used with FancyArrowPatch.
A connectionstyle object can be either created as:
ConnectionStyle.Arc3(rad=0.2)
or:
ConnectionStyle("Arc3", rad=0.2)
or:
ConnectionStyle("Arc3, rad=0.2")
The following classes are defined
Class Name Attrs Angle angle angleA=90,angleB=0,rad=0.0 Angle3 angle3 angleA=90,angleB=0 Arc arc angleA=0,angleB=0,armA=None,armB=None,rad=0.0 Arc3 arc3 rad=0.0 Bar bar armA=0.0,armB=0.0,fraction=0.3,angle=None
An instance of any connection style class is an callable object, whose call signature is:
__call__(self, posA, posB,
         patchA=None, patchB=None,
         shrinkA=2., shrinkB=2.)
and it returns a Path instance. posA and posB are tuples of x,y coordinates of the two points to be connected. patchA (or patchB) is given, the returned path is clipped so that it start (or end) from the boundary of the patch. The path is further shrunk by shrinkA (or shrinkB) which is given in points.
Bases: matplotlib.patches._Base
Creates a picewise continuous quadratic bezier path between two points. The path has a one passing-through point placed at the intersecting point of two lines which crosses the start (or end) point and has a angle of angleA (or angleB). The connecting edges are rounded with rad.
Bases: matplotlib.patches._Base
Creates a simple quadratic bezier curve between two points. The middle control points is placed at the intersecting point of two lines which crosses the start (or end) point and has a angle of angleA (or angleB).
Bases: matplotlib.patches._Base
Creates a picewise continuous quadratic bezier path between two points. The path can have two passing-through points, a point placed at the distance of armA and angle of angleA from point A, another point with respect to point B. The edges are rounded with rad.
Bases: matplotlib.patches._Base
Creates a simple quadratic bezier curve between two points. The curve is created so that the middle contol points (C1) is located at the same distance from the start (C0) and end points(C2) and the distance of the C1 to the line connecting C0-C2 is rad times the distance of C0-C2.
Bases: matplotlib.patches._Base
A line with angle between A and B with armA and armB. One of the arm is extend so that they are connected in a right angle. The length of armA is determined by (armA + fraction x AB distance). Same for armB.
armA : minimum length of armA
armB : minimum length of armB
Bases: matplotlib.patches.Patch
A scale-free ellipse.
Valid kwargs are:
Property Description agg_filter unknown alpha float or None animated [True | False] antialiased or aa [True | False] or None for default axes an Axes instance clip_box a matplotlib.transforms.Bbox instance clip_on [True | False] clip_path [ (Path, Transform) | Patch | None ] color matplotlib color spec contains a callable function edgecolor or ec mpl color spec, or None for default, or ‘none’ for no color facecolor or fc mpl color spec, or None for default, or ‘none’ for no color figure a matplotlib.figure.Figure instance fill [True | False] gid an id string hatch [‘/’ | ‘\’ | ‘|’ | ‘-‘ | ‘+’ | ‘x’ | ‘o’ | ‘O’ | ‘.’ | ‘*’] label string or anything printable with ‘%s’ conversion. linestyle or ls [‘solid’ | ‘dashed’ | ‘dashdot’ | ‘dotted’] linewidth or lw float or None for default lod [True | False] path_effects unknown picker [None|float|boolean|callable] rasterized [True | False | None] sketch_params unknown snap unknown transform Transform instance url a url string visible [True | False] zorder any number
Return the vertices of the rectangle
Bases: matplotlib.patches.Polygon
Like Arrow, but lets you set head width and head height independently.
Other valid kwargs (inherited from Patch) are:
Property Description agg_filter unknown alpha float or None animated [True | False] antialiased or aa [True | False] or None for default axes an Axes instance clip_box a matplotlib.transforms.Bbox instance clip_on [True | False] clip_path [ (Path, Transform) | Patch | None ] color matplotlib color spec contains a callable function edgecolor or ec mpl color spec, or None for default, or ‘none’ for no color facecolor or fc mpl color spec, or None for default, or ‘none’ for no color figure a matplotlib.figure.Figure instance fill [True | False] gid an id string hatch [‘/’ | ‘\’ | ‘|’ | ‘-‘ | ‘+’ | ‘x’ | ‘o’ | ‘O’ | ‘.’ | ‘*’] label string or anything printable with ‘%s’ conversion. linestyle or ls [‘solid’ | ‘dashed’ | ‘dashdot’ | ‘dotted’] linewidth or lw float or None for default lod [True | False] path_effects unknown picker [None|float|boolean|callable] rasterized [True | False | None] sketch_params unknown snap unknown transform Transform instance url a url string visible [True | False] zorder any number
Bases: matplotlib.patches.Patch
A fancy arrow patch. It draws an arrow using the :class:ArrowStyle.
If posA and posB is given, a path connecting two point are created according to the connectionstyle. The path will be clipped with patchA and patchB and further shirnked by shrinkA and shrinkB. An arrow is drawn along this resulting path using the arrowstyle parameter. If path provided, an arrow is drawn along this path and patchA, patchB, shrinkA, and shrinkB are ignored.
The connectionstyle describes how posA and posB are connected. It can be an instance of the ConnectionStyle class (matplotlib.patches.ConnectionStlye) or a string of the connectionstyle name, with optional comma-separated attributes. The following connection styles are available.
Class Name Attrs Angle angle angleA=90,angleB=0,rad=0.0 Angle3 angle3 angleA=90,angleB=0 Arc arc angleA=0,angleB=0,armA=None,armB=None,rad=0.0 Arc3 arc3 rad=0.0 Bar bar armA=0.0,armB=0.0,fraction=0.3,angle=None
The arrowstyle describes how the fancy arrow will be drawn. It can be string of the available arrowstyle names, with optional comma-separated attributes, or one of the ArrowStyle instance. The optional attributes are meant to be scaled with the mutation_scale. The following arrow styles are available.
Class Name Attrs Curve - None CurveB -> head_length=0.4,head_width=0.2 BracketB -[ widthB=1.0,lengthB=0.2,angleB=None CurveFilledB -|> head_length=0.4,head_width=0.2 CurveA <- head_length=0.4,head_width=0.2 CurveAB <-> head_length=0.4,head_width=0.2 CurveFilledA <|- head_length=0.4,head_width=0.2 CurveFilledAB <|-|> head_length=0.4,head_width=0.2 BracketA ]- widthA=1.0,lengthA=0.2,angleA=None BracketAB ]-[ widthA=1.0,lengthA=0.2,angleA=None,widthB=1.0,lengthB=0.2,angleB=None Fancy fancy head_length=0.4,head_width=0.4,tail_width=0.4 Simple simple head_length=0.5,head_width=0.5,tail_width=0.2 Wedge wedge tail_width=0.3,shrink_factor=0.5 BarAB |-| widthA=1.0,angleA=None,widthB=1.0,angleB=None
Valid kwargs are:
Property Description agg_filter unknown alpha float or None animated [True | False] antialiased or aa [True | False] or None for default axes an Axes instance clip_box a matplotlib.transforms.Bbox instance clip_on [True | False] clip_path [ (Path, Transform) | Patch | None ] color matplotlib color spec contains a callable function edgecolor or ec mpl color spec, or None for default, or ‘none’ for no color facecolor or fc mpl color spec, or None for default, or ‘none’ for no color figure a matplotlib.figure.Figure instance fill [True | False] gid an id string hatch [‘/’ | ‘\’ | ‘|’ | ‘-‘ | ‘+’ | ‘x’ | ‘o’ | ‘O’ | ‘.’ | ‘*’] label string or anything printable with ‘%s’ conversion. linestyle or ls [‘solid’ | ‘dashed’ | ‘dashdot’ | ‘dotted’] linewidth or lw float or None for default lod [True | False] path_effects unknown picker [None|float|boolean|callable] rasterized [True | False | None] sketch_params unknown snap unknown transform Transform instance url a url string visible [True | False] zorder any number
Return the arrowstyle object
Return the ConnectionStyle instance
dpi_cor is currently used for linewidth-related things and shink factor. Mutation scale is not affected by this.
Return the aspect ratio of the bbox mutation.
Return the mutation scale.
return the path of the arrow in the data coordinate. Use get_path_in_displaycoord() method to retrieve the arrow path in the display coord.
Return the mutated path of the arrow in the display coord
Set the arrow style.
comma-separated attributes. Alternatively, the attrs can be provided as keywords.
set_arrowstyle(“Fancy,head_length=0.2”) set_arrowstyle(“fancy”, head_length=0.2)
Old attrs simply are forgotten.
Without argument (or with arrowstyle=None), return available box styles as a list of strings.
Set the connection style.
optional comma-separated attributes. Alternatively, the attrs can be probided as keywords.
set_connectionstyle(“arc,angleA=0,armA=30,rad=10”) set_connectionstyle(“arc”, angleA=0,armA=30,rad=10)
Old attrs simply are forgotten.
Without argument (or with connectionstyle=None), return available styles as a list of strings.
dpi_cor is currently used for linewidth-related things and shink factor. Mutation scale is not affected by this.
Set the aspect ratio of the bbox mutation.
ACCEPTS: float
Set the mutation scale.
ACCEPTS: float
set the begin patch.
set the begin patch
set the begin end end positions of the connecting path. Use current vlaue if None.
Bases: matplotlib.patches.Patch
Draw a fancy box around a rectangle with lower left at xy*=(*x, y) with specified width and height.
FancyBboxPatch class is similar to Rectangle class, but it draws a fancy box around the rectangle. The transformation of the rectangle box to the fancy box is delegated to the BoxTransmuterBase and its derived classes.
xy = lower left corner
width, height
boxstyle determines what kind of fancy box will be drawn. It can be a string of the style name with a comma separated attribute, or an instance of BoxStyle. Following box styles are available.
Class Name Attrs LArrow larrow pad=0.3 RArrow rarrow pad=0.3 Round round pad=0.3,rounding_size=None Round4 round4 pad=0.3,rounding_size=None Roundtooth roundtooth pad=0.3,tooth_size=None Sawtooth sawtooth pad=0.3,tooth_size=None Square square pad=0.3
mutation_scale : a value with which attributes of boxstyle (e.g., pad) will be scaled. default=1.
mutation_aspect : The height of the rectangle will be squeezed by this value before the mutation and the mutated box will be stretched by the inverse of it. default=None.
Valid kwargs are:
Property Description agg_filter unknown alpha float or None animated [True | False] antialiased or aa [True | False] or None for default axes an Axes instance clip_box a matplotlib.transforms.Bbox instance clip_on [True | False] clip_path [ (Path, Transform) | Patch | None ] color matplotlib color spec contains a callable function edgecolor or ec mpl color spec, or None for default, or ‘none’ for no color facecolor or fc mpl color spec, or None for default, or ‘none’ for no color figure a matplotlib.figure.Figure instance fill [True | False] gid an id string hatch [‘/’ | ‘\’ | ‘|’ | ‘-‘ | ‘+’ | ‘x’ | ‘o’ | ‘O’ | ‘.’ | ‘*’] label string or anything printable with ‘%s’ conversion. linestyle or ls [‘solid’ | ‘dashed’ | ‘dashdot’ | ‘dotted’] linewidth or lw float or None for default lod [True | False] path_effects unknown picker [None|float|boolean|callable] rasterized [True | False | None] sketch_params unknown snap unknown transform Transform instance url a url string visible [True | False] zorder any number
Return the boxstyle object
Return the height of the rectangle
Return the aspect ratio of the bbox mutation.
Return the mutation scale.
Return the mutated path of the rectangle
Return the width of the rectangle
Return the left coord of the rectangle
Return the bottom coord of the rectangle
Set the bounds of the rectangle: l,b,w,h
ACCEPTS: (left, bottom, width, height)
Set the box style.
boxstyle can be a string with boxstyle name with optional comma-separated attributes. Alternatively, the attrs can be provided as keywords:
set_boxstyle("round,pad=0.2")
set_boxstyle("round", pad=0.2)
Old attrs simply are forgotten.
Without argument (or with boxstyle = None), it returns available box styles.
Set the width rectangle
ACCEPTS: float
Set the aspect ratio of the bbox mutation.
ACCEPTS: float
Set the mutation scale.
ACCEPTS: float
Set the width rectangle
ACCEPTS: float
Set the left coord of the rectangle
ACCEPTS: float
Set the bottom coord of the rectangle
ACCEPTS: float
Bases: matplotlib.artist.Artist
A patch is a 2D artist with a face color and an edge color.
If any of edgecolor, facecolor, linewidth, or antialiased are None, they default to their rc params setting.
The following kwarg properties are supported
| Property | Description |
|---|---|
| agg_filter | unknown |
| alpha | float or None |
| animated | [True | False] |
| antialiased or aa | [True | False] or None for default |
| axes | an Axes instance |
| clip_box | a matplotlib.transforms.Bbox instance |
| clip_on | [True | False] |
| clip_path | [ (Path, Transform) | Patch | None ] |
| color | matplotlib color spec |
| contains | a callable function |
| edgecolor or ec | mpl color spec, or None for default, or ‘none’ for no color |
| facecolor or fc | mpl color spec, or None for default, or ‘none’ for no color |
| figure | a matplotlib.figure.Figure instance |
| fill | [True | False] |
| gid | an id string |
| hatch | [‘/’ | ‘\’ | ‘|’ | ‘-‘ | ‘+’ | ‘x’ | ‘o’ | ‘O’ | ‘.’ | ‘*’] |
| label | string or anything printable with ‘%s’ conversion. |
| linestyle or ls | [‘solid’ | ‘dashed’ | ‘dashdot’ | ‘dotted’] |
| linewidth or lw | float or None for default |
| lod | [True | False] |
| path_effects | unknown |
| picker | [None|float|boolean|callable] |
| rasterized | [True | False | None] |
| sketch_params | unknown |
| snap | unknown |
| transform | Transform instance |
| url | a url string |
| visible | [True | False] |
| zorder | any number |
Test whether the mouse event occurred in the patch.
Returns T/F, {}
Returns True if the given point is inside the path (transformed with its transform attribute).
return whether fill is set
Return the Transform instance which maps data coordinates to physical coordinates.
return whether fill is set
Return the current hatching pattern
Return the linestyle. Will be one of [‘solid’ | ‘dashed’ | ‘dashdot’ | ‘dotted’]
Return the line width in points.
Return the linestyle. Will be one of [‘solid’ | ‘dashed’ | ‘dashdot’ | ‘dotted’]
Return the line width in points.
Return the Transform instance which takes patch coordinates to data coordinates.
For example, one may define a patch of a circle which represents a radius of 5 by providing coordinates for a unit circle, and a transform which scales the coordinates (the patch coordinate) by 5.
Return the path of this patch
Return a copy of the vertices used in this patch
If the patch contains Bezier curves, the curves will be interpolated by line segments. To access the curves as curves, use get_path().
alias for set_antialiased
Set the alpha tranparency of the patch.
ACCEPTS: float or None
Set whether to use antialiased rendering
ACCEPTS: [True | False] or None for default
Set both the edgecolor and the facecolor.
ACCEPTS: matplotlib color spec
See also
alias for set_edgecolor
Set the patch edge color
ACCEPTS: mpl color spec, or None for default, or ‘none’ for no color
Set the patch face color
ACCEPTS: mpl color spec, or None for default, or ‘none’ for no color
alias for set_facecolor
Set whether to fill the patch
ACCEPTS: [True | False]
Set the hatching pattern
hatch can be one of:
/   - diagonal hatching
\   - back diagonal
|   - vertical
-   - horizontal
+   - crossed
x   - crossed diagonal
o   - small circle
O   - large circle
.   - dots
*   - stars
Letters can be combined, in which case all the specified hatchings are done. If same letter repeats, it increases the density of hatching of that pattern.
Hatching is supported in the PostScript, PDF, SVG and Agg backends only.
ACCEPTS: [‘/’ | ‘\’ | ‘|’ | ‘-‘ | ‘+’ | ‘x’ | ‘o’ | ‘O’ | ‘.’ | ‘*’]
Set the patch linestyle
ACCEPTS: [‘solid’ | ‘dashed’ | ‘dashdot’ | ‘dotted’]
Set the patch linewidth in points
ACCEPTS: float or None for default
alias for set_linestyle
alias for set_linewidth
Bases: matplotlib.patches.Patch
A general polycurve path patch.
path is a matplotlib.path.Path object.
Valid kwargs are:
Property Description agg_filter unknown alpha float or None animated [True | False] antialiased or aa [True | False] or None for default axes an Axes instance clip_box a matplotlib.transforms.Bbox instance clip_on [True | False] clip_path [ (Path, Transform) | Patch | None ] color matplotlib color spec contains a callable function edgecolor or ec mpl color spec, or None for default, or ‘none’ for no color facecolor or fc mpl color spec, or None for default, or ‘none’ for no color figure a matplotlib.figure.Figure instance fill [True | False] gid an id string hatch [‘/’ | ‘\’ | ‘|’ | ‘-‘ | ‘+’ | ‘x’ | ‘o’ | ‘O’ | ‘.’ | ‘*’] label string or anything printable with ‘%s’ conversion. linestyle or ls [‘solid’ | ‘dashed’ | ‘dashdot’ | ‘dotted’] linewidth or lw float or None for default lod [True | False] path_effects unknown picker [None|float|boolean|callable] rasterized [True | False | None] sketch_params unknown snap unknown transform Transform instance url a url string visible [True | False] zorder any number
See also
Bases: matplotlib.patches.Patch
A general polygon patch.
xy is a numpy array with shape Nx2.
If closed is True, the polygon will be closed so the starting and ending points are the same.
Valid kwargs are:
Property Description agg_filter unknown alpha float or None animated [True | False] antialiased or aa [True | False] or None for default axes an Axes instance clip_box a matplotlib.transforms.Bbox instance clip_on [True | False] clip_path [ (Path, Transform) | Patch | None ] color matplotlib color spec contains a callable function edgecolor or ec mpl color spec, or None for default, or ‘none’ for no color facecolor or fc mpl color spec, or None for default, or ‘none’ for no color figure a matplotlib.figure.Figure instance fill [True | False] gid an id string hatch [‘/’ | ‘\’ | ‘|’ | ‘-‘ | ‘+’ | ‘x’ | ‘o’ | ‘O’ | ‘.’ | ‘*’] label string or anything printable with ‘%s’ conversion. linestyle or ls [‘solid’ | ‘dashed’ | ‘dashdot’ | ‘dotted’] linewidth or lw float or None for default lod [True | False] path_effects unknown picker [None|float|boolean|callable] rasterized [True | False | None] sketch_params unknown snap unknown transform Transform instance url a url string visible [True | False] zorder any number
See also
Bases: matplotlib.patches.Patch
Draw a rectangle with lower left at xy = (x, y) with specified width and height.
- angle
- rotation in degrees (anti-clockwise)
fill is a boolean indicating whether to fill the rectangle
Valid kwargs are:
| Property | Description |
|---|---|
| agg_filter | unknown |
| alpha | float or None |
| animated | [True | False] |
| antialiased or aa | [True | False] or None for default |
| axes | an Axes instance |
| clip_box | a matplotlib.transforms.Bbox instance |
| clip_on | [True | False] |
| clip_path | [ (Path, Transform) | Patch | None ] |
| color | matplotlib color spec |
| contains | a callable function |
| edgecolor or ec | mpl color spec, or None for default, or ‘none’ for no color |
| facecolor or fc | mpl color spec, or None for default, or ‘none’ for no color |
| figure | a matplotlib.figure.Figure instance |
| fill | [True | False] |
| gid | an id string |
| hatch | [‘/’ | ‘\’ | ‘|’ | ‘-‘ | ‘+’ | ‘x’ | ‘o’ | ‘O’ | ‘.’ | ‘*’] |
| label | string or anything printable with ‘%s’ conversion. |
| linestyle or ls | [‘solid’ | ‘dashed’ | ‘dashdot’ | ‘dotted’] |
| linewidth or lw | float or None for default |
| lod | [True | False] |
| path_effects | unknown |
| picker | [None|float|boolean|callable] |
| rasterized | [True | False | None] |
| sketch_params | unknown |
| snap | unknown |
| transform | Transform instance |
| url | a url string |
| visible | [True | False] |
| zorder | any number |
Return the height of the rectangle
Return the vertices of the rectangle
Return the width of the rectangle
Return the left coord of the rectangle
Return the left and bottom coords of the rectangle
Return the bottom coord of the rectangle
Set the bounds of the rectangle: l,b,w,h
ACCEPTS: (left, bottom, width, height)
Set the width rectangle
ACCEPTS: float
Set the width rectangle
ACCEPTS: float
Set the left coord of the rectangle
ACCEPTS: float
Set the left and bottom coords of the rectangle
ACCEPTS: 2-item sequence
Set the bottom coord of the rectangle
ACCEPTS: float
Return the left and bottom coords of the rectangle
Bases: matplotlib.patches.Patch
A regular polygon patch.
Constructor arguments:
Valid kwargs are:
Property Description agg_filter unknown alpha float or None animated [True | False] antialiased or aa [True | False] or None for default axes an Axes instance clip_box a matplotlib.transforms.Bbox instance clip_on [True | False] clip_path [ (Path, Transform) | Patch | None ] color matplotlib color spec contains a callable function edgecolor or ec mpl color spec, or None for default, or ‘none’ for no color facecolor or fc mpl color spec, or None for default, or ‘none’ for no color figure a matplotlib.figure.Figure instance fill [True | False] gid an id string hatch [‘/’ | ‘\’ | ‘|’ | ‘-‘ | ‘+’ | ‘x’ | ‘o’ | ‘O’ | ‘.’ | ‘*’] label string or anything printable with ‘%s’ conversion. linestyle or ls [‘solid’ | ‘dashed’ | ‘dashdot’ | ‘dotted’] linewidth or lw float or None for default lod [True | False] path_effects unknown picker [None|float|boolean|callable] rasterized [True | False | None] sketch_params unknown snap unknown transform Transform instance url a url string visible [True | False] zorder any number
Bases: matplotlib.patches.Patch
Create a shadow of the given patch offset by ox, oy. props, if not None, is a patch property update dictionary. If None, the shadow will have have the same color as the face, but darkened.
kwargs are
Property Description agg_filter unknown alpha float or None animated [True | False] antialiased or aa [True | False] or None for default axes an Axes instance clip_box a matplotlib.transforms.Bbox instance clip_on [True | False] clip_path [ (Path, Transform) | Patch | None ] color matplotlib color spec contains a callable function edgecolor or ec mpl color spec, or None for default, or ‘none’ for no color facecolor or fc mpl color spec, or None for default, or ‘none’ for no color figure a matplotlib.figure.Figure instance fill [True | False] gid an id string hatch [‘/’ | ‘\’ | ‘|’ | ‘-‘ | ‘+’ | ‘x’ | ‘o’ | ‘O’ | ‘.’ | ‘*’] label string or anything printable with ‘%s’ conversion. linestyle or ls [‘solid’ | ‘dashed’ | ‘dashdot’ | ‘dotted’] linewidth or lw float or None for default lod [True | False] path_effects unknown picker [None|float|boolean|callable] rasterized [True | False | None] sketch_params unknown snap unknown transform Transform instance url a url string visible [True | False] zorder any number
Bases: matplotlib.patches.Patch
Wedge shaped patch.
Draw a wedge centered at x, y center with radius r that sweeps theta1 to theta2 (in degrees). If width is given, then a partial wedge is drawn from inner radius r - width to outer radius r.
Valid kwargs are:
Property Description agg_filter unknown alpha float or None animated [True | False] antialiased or aa [True | False] or None for default axes an Axes instance clip_box a matplotlib.transforms.Bbox instance clip_on [True | False] clip_path [ (Path, Transform) | Patch | None ] color matplotlib color spec contains a callable function edgecolor or ec mpl color spec, or None for default, or ‘none’ for no color facecolor or fc mpl color spec, or None for default, or ‘none’ for no color figure a matplotlib.figure.Figure instance fill [True | False] gid an id string hatch [‘/’ | ‘\’ | ‘|’ | ‘-‘ | ‘+’ | ‘x’ | ‘o’ | ‘O’ | ‘.’ | ‘*’] label string or anything printable with ‘%s’ conversion. linestyle or ls [‘solid’ | ‘dashed’ | ‘dashdot’ | ‘dotted’] linewidth or lw float or None for default lod [True | False] path_effects unknown picker [None|float|boolean|callable] rasterized [True | False | None] sketch_params unknown snap unknown transform Transform instance url a url string visible [True | False] zorder any number
Bases: matplotlib.patches.Patch
Yet another arrow class.
This is an arrow that is defined in display space and has a tip at x1, y1 and a base at x2, y2.
Constructor arguments:
Valid kwargs are:
Property Description agg_filter unknown alpha float or None animated [True | False] antialiased or aa [True | False] or None for default axes an Axes instance clip_box a matplotlib.transforms.Bbox instance clip_on [True | False] clip_path [ (Path, Transform) | Patch | None ] color matplotlib color spec contains a callable function edgecolor or ec mpl color spec, or None for default, or ‘none’ for no color facecolor or fc mpl color spec, or None for default, or ‘none’ for no color figure a matplotlib.figure.Figure instance fill [True | False] gid an id string hatch [‘/’ | ‘\’ | ‘|’ | ‘-‘ | ‘+’ | ‘x’ | ‘o’ | ‘O’ | ‘.’ | ‘*’] label string or anything printable with ‘%s’ conversion. linestyle or ls [‘solid’ | ‘dashed’ | ‘dashdot’ | ‘dotted’] linewidth or lw float or None for default lod [True | False] path_effects unknown picker [None|float|boolean|callable] rasterized [True | False | None] sketch_params unknown snap unknown transform Transform instance url a url string visible [True | False] zorder any number
For line segment defined by (x1, y1) and (x2, y2) return the points on the line that is perpendicular to the line and intersects (x2, y2) and the distance from (x2, y2) of the returned points is k.
This is a debug function to draw a rectangle around the bounding box returned by get_window_extent() of an artist, to test whether the artist is returning the correct bbox.
props is a dict of rectangle props with the additional property ‘pad’ that sets the padding around the bbox in points.
This is a debug function to draw a rectangle around the bounding box returned by get_window_extent() of an artist, to test whether the artist is returning the correct bbox.
Classes for including text in a figure.
Bases: matplotlib.text.Text, matplotlib.text._AnnotationBase
A Text class to make annotating things in the figure, such as Figure, Axes, Rectangle, etc., easier.
Annotate the x, y point xy with text s at x, y location xytext. (If xytext = None, defaults to xy, and if textcoords = None, defaults to xycoords).
arrowprops, if not None, is a dictionary of line properties (see matplotlib.lines.Line2D) for the arrow that connects annotation to the point.
If the dictionary has a key arrowstyle, a FancyArrowPatch instance is created with the given dictionary and is drawn. Otherwise, a YAArow patch instance is created and drawn. Valid keys for YAArow are
| Key | Description |
|---|---|
| width | the width of the arrow in points |
| frac | the fraction of the arrow length occupied by the head |
| headwidth | the width of the base of the arrow head in points |
| shrink | oftentimes it is convenient to have the arrowtip and base a bit away from the text and point being annotated. If d is the distance between the text and annotated point, shrink will shorten the arrow so the tip and base are shink percent of the distance d away from the endpoints. ie, shrink=0.05 is 5% |
| ? | any key for matplotlib.patches.polygon |
Valid keys for FancyArrowPatch are
| Key | Description |
|---|---|
| arrowstyle | the arrow style |
| connectionstyle | the connection style |
| relpos | default is (0.5, 0.5) |
| patchA | default is bounding box of the text |
| patchB | default is None |
| shrinkA | default is 2 points |
| shrinkB | default is 2 points |
| mutation_scale | default is text size (in points) |
| mutation_aspect | default is 1. |
| ? | any key for matplotlib.patches.PathPatch |
xycoords and textcoords are strings that indicate the coordinates of xy and xytext.
| Property | Description |
|---|---|
| ‘figure points’ | points from the lower left corner of the figure |
| ‘figure pixels’ | pixels from the lower left corner of the figure |
| ‘figure fraction’ | 0,0 is lower left of figure and 1,1 is upper right |
| ‘axes points’ | points from lower left corner of axes |
| ‘axes pixels’ | pixels from lower left corner of axes |
| ‘axes fraction’ | 0,0 is lower left of axes and 1,1 is upper right |
| ‘data’ | use the coordinate system of the object being annotated (default) |
| ‘offset points’ | Specify an offset (in points) from the xy value |
| ‘polar’ | you can specify theta, r for the annotation, even in cartesian plots. Note that if you are using a polar axes, you do not need to specify polar for the coordinate system since that is the native “data” coordinate system. |
If a ‘points’ or ‘pixels’ option is specified, values will be added to the bottom-left and if negative, values will be subtracted from the top-right. e.g.:
# 10 points to the right of the left border of the axes and
# 5 points below the top border
xy=(10,-5), xycoords='axes points'
You may use an instance of Transform or Artist. See Annotating Axes for more details.
The annotation_clip attribute contols the visibility of the annotation when it goes outside the axes area. If True, the annotation will only be drawn when the xy is inside the axes. If False, the annotation will always be drawn regardless of its position. The default is None, which behave as True only if xycoords is”data”.
Additional kwargs are Text properties:
Property Description agg_filter unknown alpha float (0.0 transparent through 1.0 opaque) animated [True | False] axes an Axes instance backgroundcolor any matplotlib color bbox rectangle prop dict clip_box a matplotlib.transforms.Bbox instance clip_on [True | False] clip_path [ (Path, Transform) | Patch | None ] color any matplotlib color contains a callable function family or fontfamily or fontname or name [FONTNAME | ‘serif’ | ‘sans-serif’ | ‘cursive’ | ‘fantasy’ | ‘monospace’ ] figure a matplotlib.figure.Figure instance fontproperties or font_properties a matplotlib.font_manager.FontProperties instance gid an id string horizontalalignment or ha [ ‘center’ | ‘right’ | ‘left’ ] label string or anything printable with ‘%s’ conversion. linespacing float (multiple of font size) lod [True | False] multialignment [‘left’ | ‘right’ | ‘center’ ] path_effects unknown picker [None|float|boolean|callable] position (x,y) rasterized [True | False | None] rotation [ angle in degrees | ‘vertical’ | ‘horizontal’ ] rotation_mode unknown size or fontsize [size in points | ‘xx-small’ | ‘x-small’ | ‘small’ | ‘medium’ | ‘large’ | ‘x-large’ | ‘xx-large’ ] sketch_params unknown snap unknown stretch or fontstretch [a numeric value in range 0-1000 | ‘ultra-condensed’ | ‘extra-condensed’ | ‘condensed’ | ‘semi-condensed’ | ‘normal’ | ‘semi-expanded’ | ‘expanded’ | ‘extra-expanded’ | ‘ultra-expanded’ ] style or fontstyle [ ‘normal’ | ‘italic’ | ‘oblique’] text string or anything printable with ‘%s’ conversion. transform Transform instance url a url string variant or fontvariant [ ‘normal’ | ‘small-caps’ ] verticalalignment or va or ma [ ‘center’ | ‘top’ | ‘bottom’ | ‘baseline’ ] visible [True | False] weight or fontweight [a numeric value in range 0-1000 | ‘ultralight’ | ‘light’ | ‘normal’ | ‘regular’ | ‘book’ | ‘medium’ | ‘roman’ | ‘semibold’ | ‘demibold’ | ‘demi’ | ‘bold’ | ‘heavy’ | ‘extra bold’ | ‘black’ ] x float y float zorder any number
Draw the Annotation object to the given renderer.
Update the location and the size of the bbox. This method should be used when the position and size of the bbox needs to be updated before actually drawing the bbox.
“Update the pixel positions of the annotated point and the text.
Bases: object
Bases: matplotlib.artist.Artist
Handle storing and drawing of text in window or data coordinates.
Create a Text instance at x, y with string text.
Valid kwargs are
Property Description agg_filter unknown alpha float (0.0 transparent through 1.0 opaque) animated [True | False] axes an Axes instance backgroundcolor any matplotlib color bbox rectangle prop dict clip_box a matplotlib.transforms.Bbox instance clip_on [True | False] clip_path [ (Path, Transform) | Patch | None ] color any matplotlib color contains a callable function family or fontfamily or fontname or name [FONTNAME | ‘serif’ | ‘sans-serif’ | ‘cursive’ | ‘fantasy’ | ‘monospace’ ] figure a matplotlib.figure.Figure instance fontproperties or font_properties a matplotlib.font_manager.FontProperties instance gid an id string horizontalalignment or ha [ ‘center’ | ‘right’ | ‘left’ ] label string or anything printable with ‘%s’ conversion. linespacing float (multiple of font size) lod [True | False] multialignment [‘left’ | ‘right’ | ‘center’ ] path_effects unknown picker [None|float|boolean|callable] position (x,y) rasterized [True | False | None] rotation [ angle in degrees | ‘vertical’ | ‘horizontal’ ] rotation_mode unknown size or fontsize [size in points | ‘xx-small’ | ‘x-small’ | ‘small’ | ‘medium’ | ‘large’ | ‘x-large’ | ‘xx-large’ ] sketch_params unknown snap unknown stretch or fontstretch [a numeric value in range 0-1000 | ‘ultra-condensed’ | ‘extra-condensed’ | ‘condensed’ | ‘semi-condensed’ | ‘normal’ | ‘semi-expanded’ | ‘expanded’ | ‘extra-expanded’ | ‘ultra-expanded’ ] style or fontstyle [ ‘normal’ | ‘italic’ | ‘oblique’] text string or anything printable with ‘%s’ conversion. transform Transform instance url a url string variant or fontvariant [ ‘normal’ | ‘small-caps’ ] verticalalignment or va or ma [ ‘center’ | ‘top’ | ‘bottom’ | ‘baseline’ ] visible [True | False] weight or fontweight [a numeric value in range 0-1000 | ‘ultralight’ | ‘light’ | ‘normal’ | ‘regular’ | ‘book’ | ‘medium’ | ‘roman’ | ‘semibold’ | ‘demibold’ | ‘demi’ | ‘bold’ | ‘heavy’ | ‘extra bold’ | ‘black’ ] x float y float zorder any number
Test whether the mouse event occurred in the patch.
In the case of text, a hit is true anywhere in the axis-aligned bounding-box containing the text.
Returns True or False.
Return the bbox Patch object. Returns None if the the FancyBboxPatch is not made.
Return the color of the text
Return the list of font families used for font lookup
alias for get_fontproperties
alias for get_family
alias for get_name
Return the FontProperties object
alias for get_size
alias for get_stretch
alias for get_style
alias for get_variant
alias for get_weight
alias for get_horizontalalignment
Return the horizontal alignment as string. Will be one of ‘left’, ‘center’ or ‘right’.
Return the font name as string
Return the position of the text as a tuple (x, y)
Return a hashable tuple of properties.
Not intended to be human readable, but useful for backends who want to cache derived information about text (eg layouts) and need to know if the text has changed.
return the text angle as float in degrees
get text rotation mode
Return the font size as integer
Get the font stretch as a string or number
Return the font style as string
Get the text as string
alias for getverticalalignment()
Return the font variant as a string
Return the vertical alignment as string. Will be one of ‘top’, ‘center’, ‘bottom’ or ‘baseline’.
Get the font weight as string or number
Return a Bbox object bounding the text, in display units.
In addition to being used internally, this is useful for specifying clickable regions in a png file on a web page.
renderer defaults to the _renderer attribute of the text object. This is not assigned until the first execution of draw(), so you must use this kwarg if you want to call get_window_extent() prior to the first draw(). For getting web page regions, it is simpler to call the method after saving the figure.
dpi defaults to self.figure.dpi; the renderer dpi is irrelevant. For the web application, if figure.dpi is not the value used when saving the figure, then the value that was used must be specified as the dpi argument.
Returns a cleaned string and a boolean flag. The flag indicates if the given string s contains any mathtext, determined by counting unescaped dollar signs. If no mathtext is present, the cleaned string has its dollar signs unescaped. If usetex is on, the flag always has the value “TeX”.
Set the background color of the text by updating the bbox.
See also
ACCEPTS: any matplotlib color
Draw a bounding box around self. rectprops are any settable properties for a rectangle, eg facecolor=’red’, alpha=0.5.
t.set_bbox(dict(facecolor=’red’, alpha=0.5))
If rectprops has “boxstyle” key. A FancyBboxPatch is initialized with rectprops and will be drawn. The mutation scale of the FancyBboxPath is set to the fontsize.
ACCEPTS: rectangle prop dict
Set the foreground color of the text
ACCEPTS: any matplotlib color
Set the font family. May be either a single string, or a list of strings in decreasing priority. Each string may be either a real font name or a generic font class name. If the latter, the specific font names will be looked up in the matplotlibrc file.
alias for set_fontproperties
alias for set_family
Set the font properties that control the text. fp must be a matplotlib.font_manager.FontProperties object.
ACCEPTS: a matplotlib.font_manager.FontProperties instance
alias for set_size
alias for set_stretch
alias for set_style
alias for set_variant
alias for set_weight
alias for set_horizontalalignment
Set the horizontal alignment to one of
ACCEPTS: [ ‘center’ | ‘right’ | ‘left’ ]
Set the line spacing as a multiple of the font size. Default is 1.2.
ACCEPTS: float (multiple of font size)
alias for set_verticalalignment
Set the alignment for multiple lines layout. The layout of the bounding box of all the lines is determined bu the horizontalalignment and verticalalignment properties, but the multiline text within that box can be
ACCEPTS: [‘left’ | ‘right’ | ‘center’ ]
alias for set_family
Set the (x, y) position of the text
ACCEPTS: (x,y)
Set the rotation of the text
ACCEPTS: [ angle in degrees | ‘vertical’ | ‘horizontal’ ]
set text rotation mode. If “anchor”, the un-rotated text will first aligned according to their ha and va, and then will be rotated with the alignement reference point as a origin. If None (default), the text will be rotated first then will be aligned.
Set the font size. May be either a size string, relative to the default font size, or an absolute font size in points.
Set the font stretch (horizontal condensation or expansion).
Set the font style.
ACCEPTS: [ ‘normal’ | ‘italic’ | ‘oblique’]
Set the text string s
It may contain newlines (\n) or math in LaTeX syntax.
ACCEPTS: string or anything printable with ‘%s’ conversion.
alias for set_verticalalignment
Set the font variant, either ‘normal’ or ‘small-caps’.
ACCEPTS: [ ‘normal’ | ‘small-caps’ ]
Set the vertical alignment
ACCEPTS: [ ‘center’ | ‘top’ | ‘bottom’ | ‘baseline’ ]
Set the font weight.
Set the x position of the text
ACCEPTS: float
Set the y position of the text
ACCEPTS: float
Update the location and the size of the bbox. This method should be used when the position and size of the bbox needs to be updated before actually drawing the bbox.
Copy properties from other to self
Bases: matplotlib.text.Text
This is basically a Text with a dash (drawn with a Line2D) before/after it. It is intended to be a drop-in replacement for Text, and should behave identically to it when dashlength = 0.0.
The dash always comes between the point specified by set_position() and the text. When a dash exists, the text alignment arguments (horizontalalignment, verticalalignment) are ignored.
dashlength is the length of the dash in canvas units. (default = 0.0).
dashdirection is one of 0 or 1, where 0 draws the dash after the text and 1 before. (default = 0).
dashrotation specifies the rotation of the dash, and should generally stay None. In this case get_dashrotation() returns get_rotation(). (I.e., the dash takes its rotation from the text’s rotation). Because the text center is projected onto the dash, major deviations in the rotation cause what may be considered visually unappealing results. (default = None)
dashpad is a padding length to add (or subtract) space between the text and the dash, in canvas units. (default = 3)
dashpush “pushes” the dash and text away from the point specified by set_position() by the amount in canvas units. (default = 0)
Note
The alignment of the two objects is based on the bounding box of the Text, as obtained by get_window_extent(). This, in turn, appears to depend on the font metrics as given by the rendering backend. Hence the quality of the “centering” of the label text with respect to the dash varies depending on the backend used.
Note
I’m not sure that I got the get_window_extent() right, or whether that’s sufficient for providing the object bounding box.
Draw the TextWithDash object to the given renderer.
Get the direction dash. 1 is before the text and 0 is after.
Get the length of the dash.
Get the extra spacing between the dash and the text, in canvas units.
Get the extra spacing between the dash and the specified text position, in canvas units.
Get the rotation of the dash in degrees.
return the figure instance the artist belongs to
Return the position of the text as a tuple (x, y)
Return a hashable tuple of properties.
Not intended to be human readable, but useful for backends who want to cache derived information about text (eg layouts) and need to know if the text has changed.
Return a Bbox object bounding the text, in display units.
In addition to being used internally, this is useful for specifying clickable regions in a png file on a web page.
renderer defaults to the _renderer attribute of the text object. This is not assigned until the first execution of draw(), so you must use this kwarg if you want to call get_window_extent() prior to the first draw(). For getting web page regions, it is simpler to call the method after saving the figure.
Set the direction of the dash following the text. 1 is before the text and 0 is after. The default is 0, which is what you’d want for the typical case of ticks below and on the left of the figure.
ACCEPTS: int (1 is before, 0 is after)
Set the length of the dash.
ACCEPTS: float (canvas units)
Set the “pad” of the TextWithDash, which is the extra spacing between the dash and the text, in canvas units.
ACCEPTS: float (canvas units)
Set the “push” of the TextWithDash, which is the extra spacing between the beginning of the dash and the specified position.
ACCEPTS: float (canvas units)
Set the rotation of the dash, in degrees
ACCEPTS: float (degrees)
Set the figure instance the artist belong to.
ACCEPTS: a matplotlib.figure.Figure instance
Set the (x, y) position of the TextWithDash.
ACCEPTS: (x, y)
Set the matplotlib.transforms.Transform instance used by this artist.
ACCEPTS: a matplotlib.transforms.Transform instance
Set the x position of the TextWithDash.
ACCEPTS: float
Set the y position of the TextWithDash.
ACCEPTS: float
Computes the actual x, y coordinates for text based on the input x, y and the dashlength. Since the rotation is with respect to the actual canvas’s coordinates we need to map back and forth.
Return the text angle as float.
rotation may be ‘horizontal’, ‘vertical’, or a numeric value in degrees.
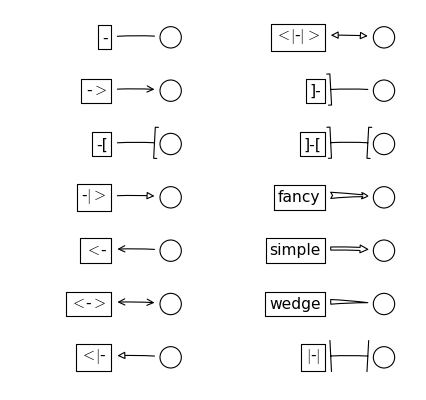
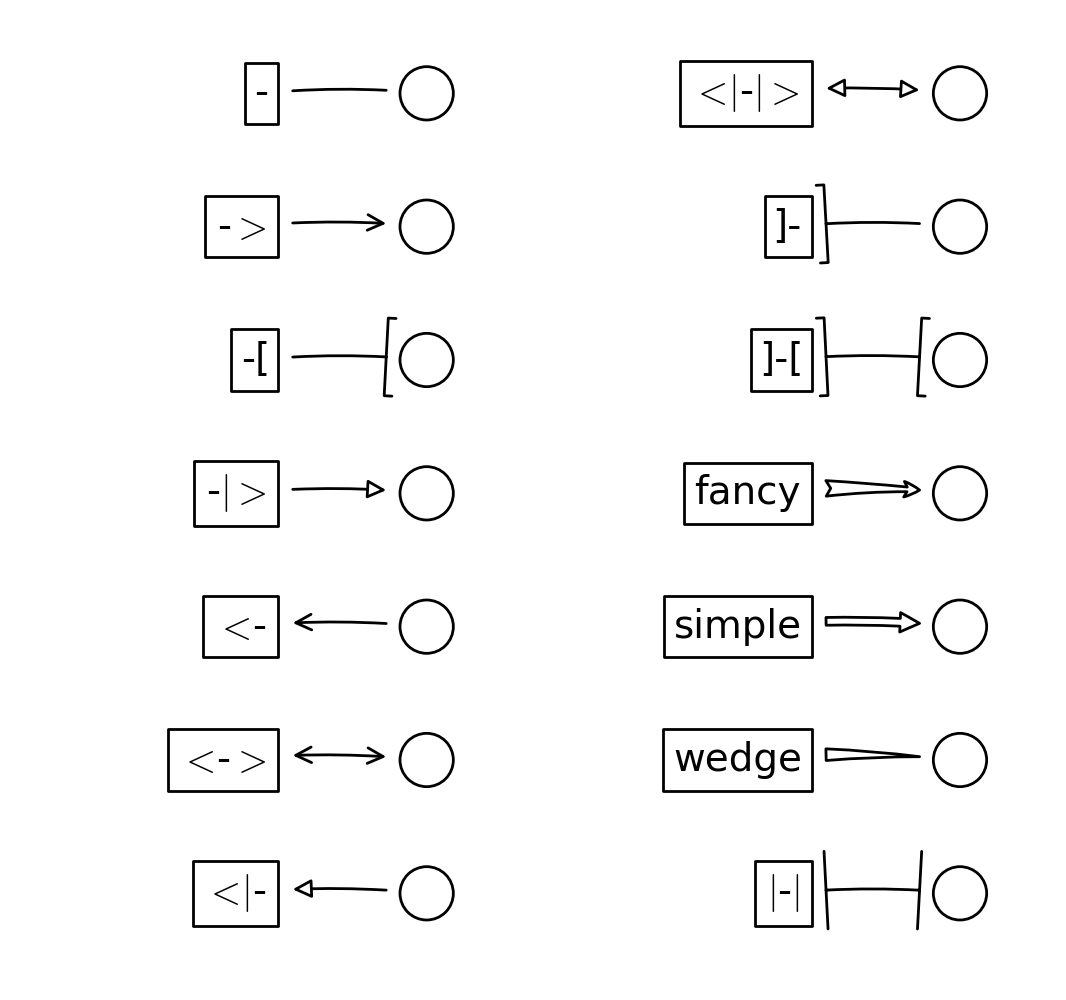
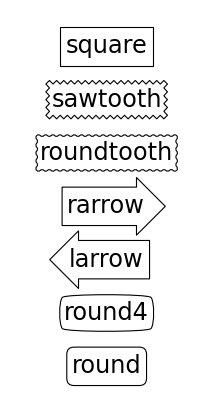
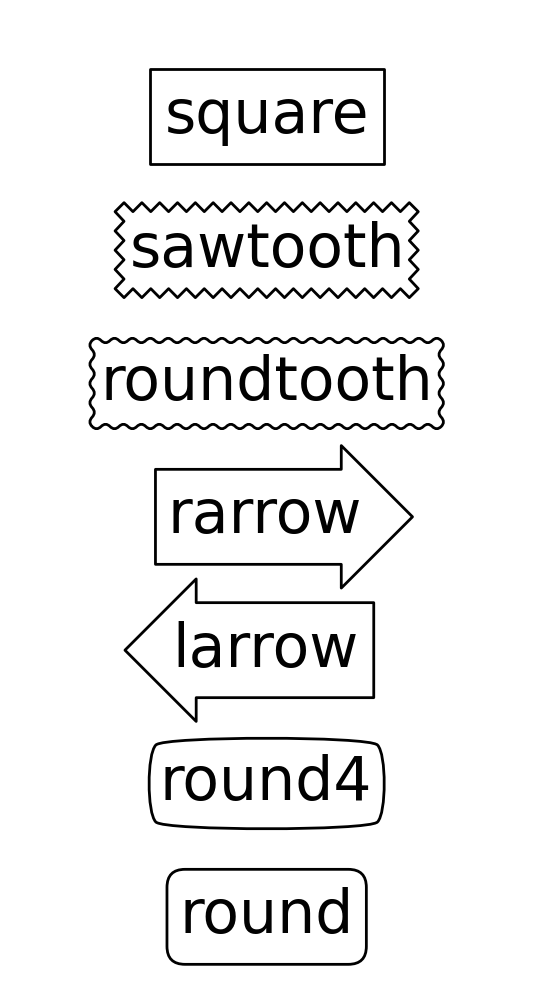