
(Source code, png, hires.png, pdf)

#!/usr/bin/env python
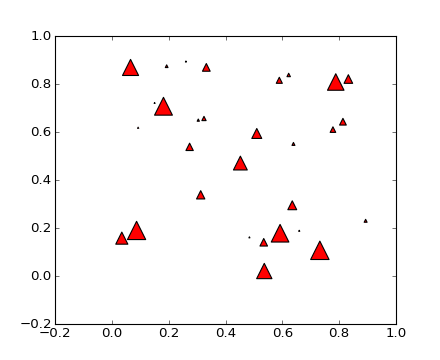
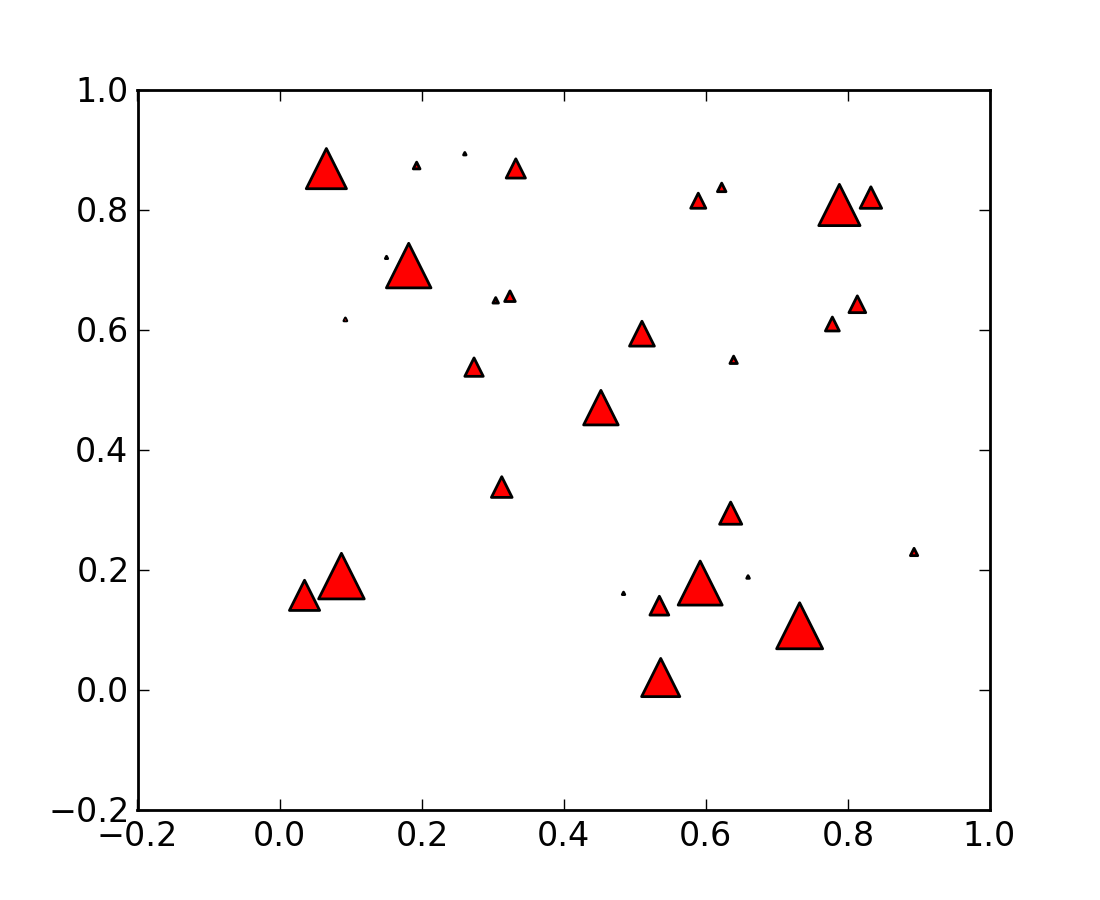
from pylab import *
N = 30
x = 0.9*rand(N)
y = 0.9*rand(N)
area = pi*(10 * rand(N))**2 # 0 to 10 point radiuses
scatter(x,y,s=area, marker='^', c='r')
show()
Keywords: python, matplotlib, pylab, example, codex (see Search examples)