
(Source code, png, hires.png, pdf)
#!/usr/bin/env python
"""
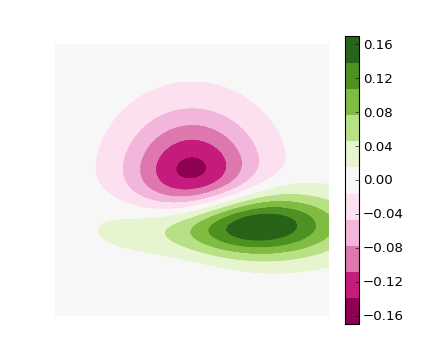
Use a pcolor or imshow with a custom colormap to make a contour plot.
Since this example was initially written, a proper contour routine was
added to matplotlib - see contour_demo.py and
http://matplotlib.sf.net/matplotlib.pylab.html#-contour.
"""
from pylab import *
delta = 0.01
x = arange(-3.0, 3.0, delta)
y = arange(-3.0, 3.0, delta)
X,Y = meshgrid(x, y)
Z1 = bivariate_normal(X, Y, 1.0, 1.0, 0.0, 0.0)
Z2 = bivariate_normal(X, Y, 1.5, 0.5, 1, 1)
Z = Z2 - Z1 # difference of Gaussians
cmap = cm.get_cmap('PiYG', 11) # 11 discrete colors
im = imshow(Z, cmap=cmap, interpolation='bilinear',
vmax=abs(Z).max(), vmin=-abs(Z).max())
axis('off')
colorbar()
show()
Keywords: python, matplotlib, pylab, example, codex (see Search examples)