
(Source code, png, hires.png, pdf)

#!/usr/bin/env python
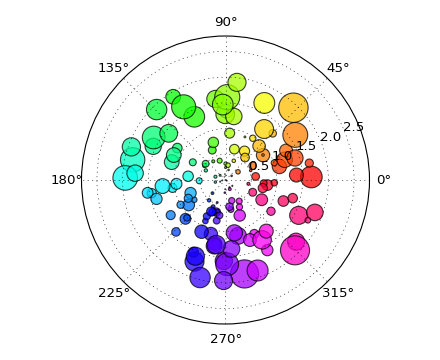
# a polar scatter plot; size increases radially in this example and
# color increases with angle (just to verify the symbols are being
# scattered correctly). In a real example, this would be wasting
# dimensionality of the plot
from pylab import *
N = 150
r = 2*rand(N)
theta = 2*pi*rand(N)
area = 200*r**2*rand(N)
colors = theta
ax = subplot(111, polar=True)
c = scatter(theta, r, c=colors, s=area, cmap=cm.hsv)
c.set_alpha(0.75)
show()
Keywords: python, matplotlib, pylab, example, codex (see Search examples)