
(Source code, png, hires.png, pdf)

from matplotlib.pyplot import figure, show
from numpy import arange, sin, pi
fig = figure()
ax = fig.add_subplot(111)
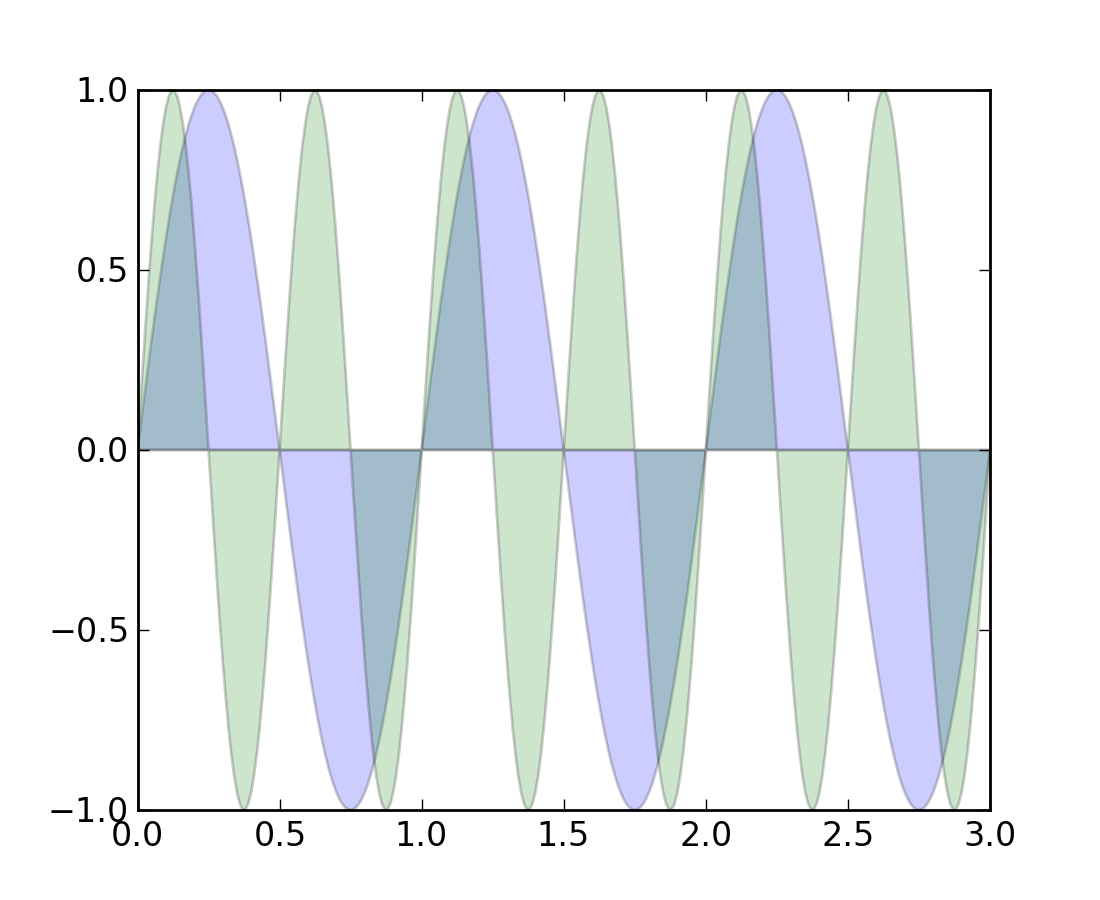
t = arange(0.0,3.01,0.01)
s = sin(2*pi*t)
c = sin(4*pi*t)
ax.fill(t, s, 'b', t, c, 'g', alpha=0.2)
show()
Keywords: python, matplotlib, pylab, example, codex (see Search examples)