
#!/usr/bin/env python
# make a horizontal bar chart
from pylab import *
val = 3+10*rand(5) # the bar lengths
pos = arange(5)+.5 # the bar centers on the y axis
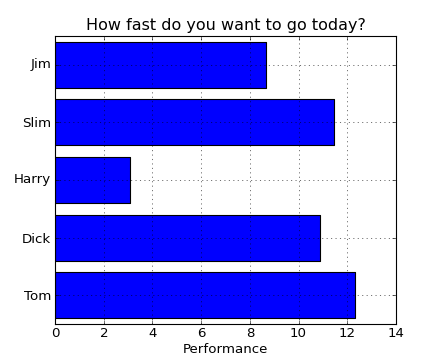
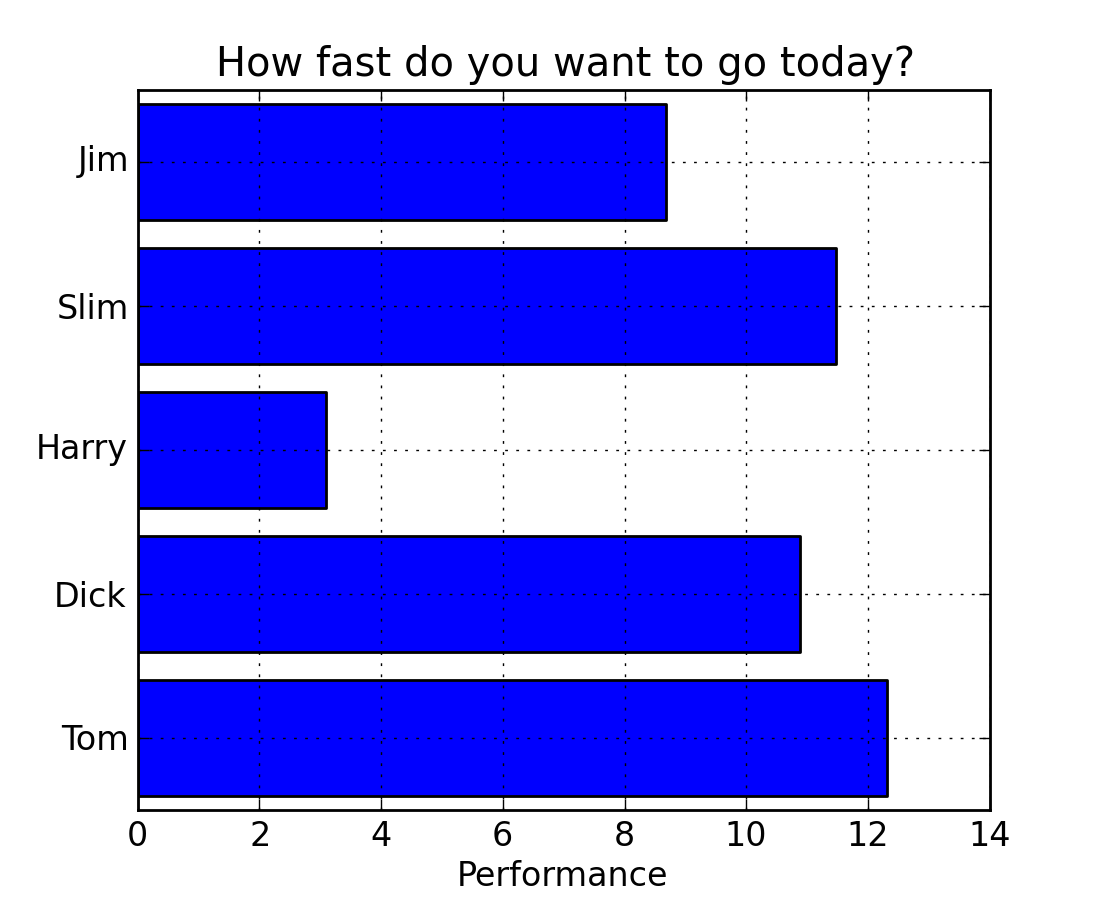
figure(1)
barh(pos,val, align='center')
yticks(pos, ('Tom', 'Dick', 'Harry', 'Slim', 'Jim'))
xlabel('Performance')
title('How fast do you want to go today?')
grid(True)
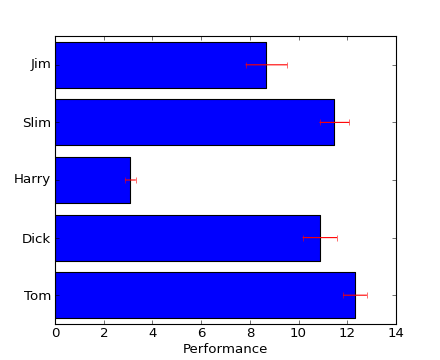
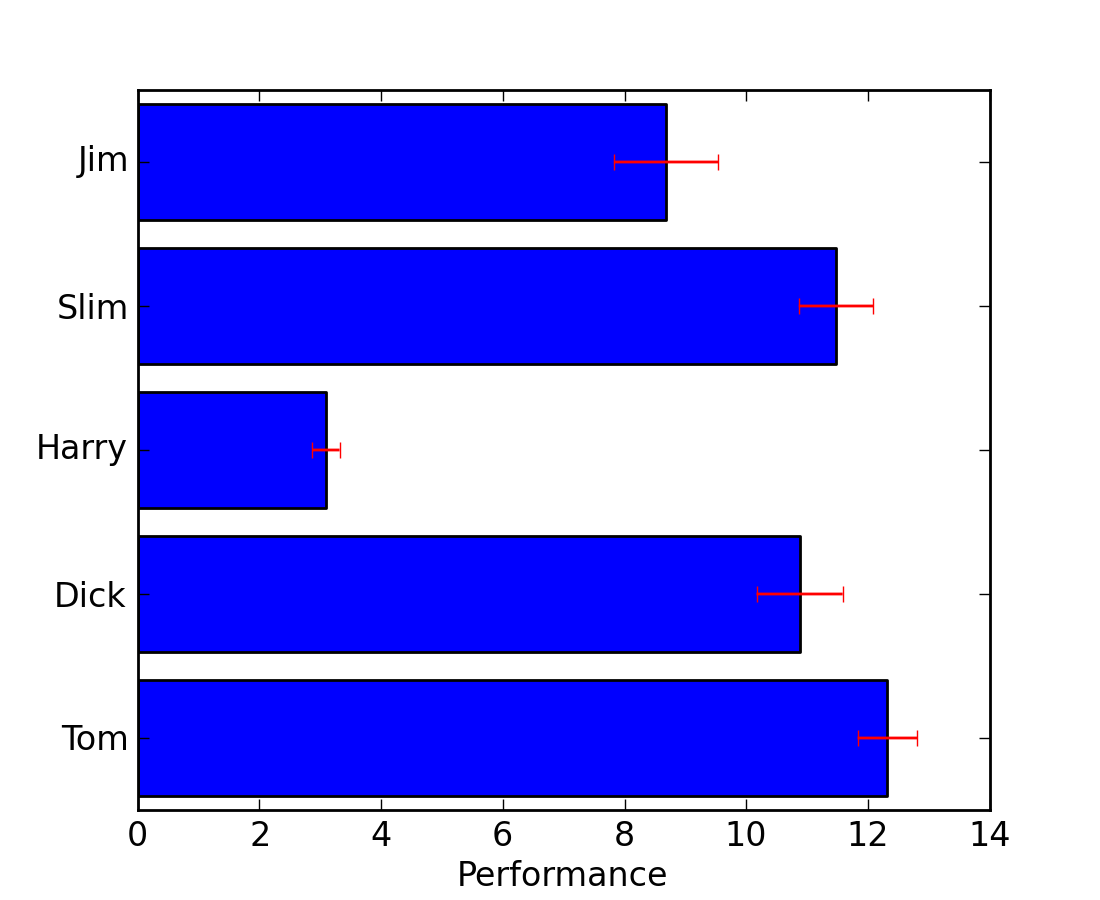
figure(2)
barh(pos,val, xerr=rand(5), ecolor='r', align='center')
yticks(pos, ('Tom', 'Dick', 'Harry', 'Slim', 'Jim'))
xlabel('Performance')
show()
Keywords: python, matplotlib, pylab, example, codex (see Search examples)
